Protein Structure Characterization
Protein structure characterization is essential for understanding protein function, and Creative Biostructure's protein characterization provides an in-depth and highly sensitive analysis of protein samples obtained by purification or by expression. Protein structures can be characterized at different levels.
- First-order structure: the sequence of amino acids in a polypeptide chain. The first-order sequence of a protein is used to define its structure and function.
- Second-order structure: includes the local structure within the protein backbone. Common types of second-order structures are α-helices and β-folded lamellae, which are held in place by hydrogen bonds.
- Third-order structure: the three-dimensional shape of the protein.
- Fourth-order structure: the structure of a multi-protein complex (e.g., dimer or trimer).
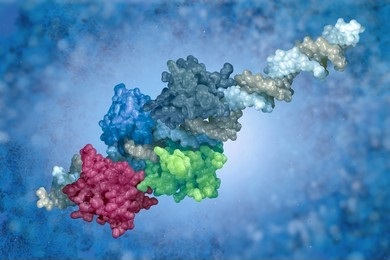
Second-, third- and fourth-order structures are often referred to collectively as the higher-order structure of a protein (HOS). HOS characterization is performed by our various biophysical solutions, including:
- Circular dichroism (CD) spectroscopy
- Mass spectrometry (MS)
- Top-down MS: it is capable of analyzing structural information at the level of intact proteins and peptide fragments. Top-down mass spectrometry can be combined with non-denaturing mass spectrometry to analyze the structure and subunit types and modifications of protein complexes; in combination with hydrogen/deuterium exchange mass spectrometry, it provides higher spatial resolution for conformational or binding interface analysis and enables conformation-specific characterization.
- Organic MS: it is one of the key technical tools in the structure identification of organic compounds. Among them, organic small molecule mass spectrometry is divided into high and low-resolution testing and spectrum analysis of single small molecule compounds, qualitative analysis of complex mixtures, and quantitative analysis of small molecule compound components. The mass spectrometry of biological macromolecules is divided into protein post-translational modification determination, large-scale protein identification and quantification, protein molecular weight determination, in-gel enzymatic digestion, and shotgun protein identification.
- Fourier Transform Infrared Spectroscopy (FTIR)
- A data-centric approach
- Infer semantic similarities between proteins.
- Predicting ontology-based protein functions.
- Classification of drug target protein families.
CD spectroscopy is the most widely used method for determining the secondary structure of proteins and is a fast, simple, and more accurate method for studying the conformation of proteins in dilute solutions. It can be measured in the solution state, which is closer to its physiological state, and is a fast and easy method that is sensitive to conformational changes.
We offer protein CD assay services. CD spectra in the far-UV region (190-250 nm) can reflect the peptide bonding information of proteins and can provide information on the main secondary structure components of proteins. The chromogenic groups in the near-UV region (250-350 nm) are aromatic amino acids, and their CD signals can reflect the changes in protein tertiary structure. By comparing the spectra of two protein samples, we can provide information on the similarity between the samples. The advantage of this method is that the experiment can be measured in the solution state, which is closer to the physiological state of the protein.
Characterization of protein HOS and dynamics is critical to understanding the biological function of proteins and revealing underlying mechanisms. MS methods play an important role in protein HOS analysis because of their low sample volume requirements, high throughput, and medium to high-resolution information.
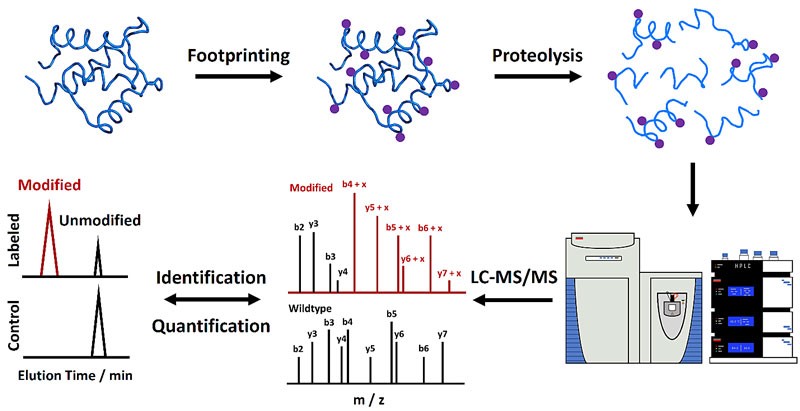 Figure 1. Mass spectrometry-based protein footprinting for higher-order structural analysis. (Liu, X. R., et al., 2020)
FTIR is an absorption spectrum that can be used to analyze the vibrational and rotational state of molecules. The main infrared characteristic absorption bands of proteins and peptides include the amide I band (C=O stretching vibration) and the amide II band (C-N stretching vibration). Different protein secondary structures (e.g., α-helix and β-fold) with different hydrogen bonds will exhibit different characteristic frequencies and intensities in the amide I band region. We use FTIR to provide accurate and efficient percentages of protein α-helices and β-folds. Compared to other techniques, FTIR sample preparation is simpler, less time-consuming to detect, and does not depend on sample concentration.
Data-centric approaches have been used to develop predictive methods to elucidate uncharacterized aspects of proteins, such as their function, biophysical properties, subcellular location, and interactions. We can classify and interpret each method and then benchmark them.
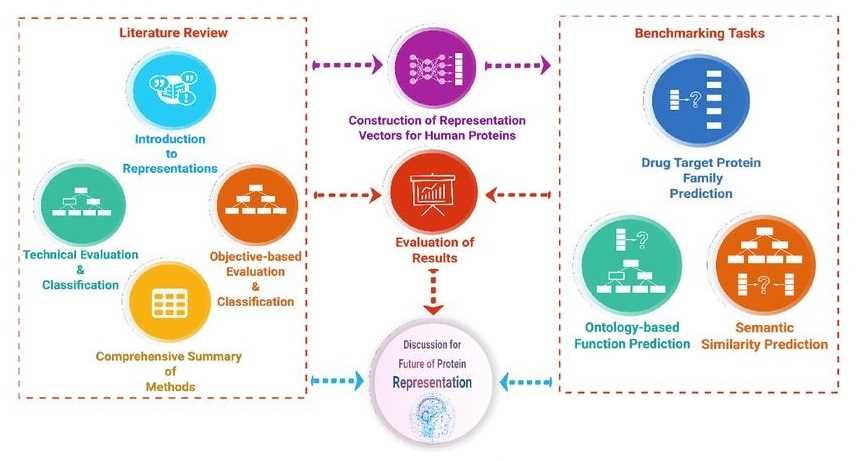 Figure 2. Overview of the protein representation benchmark study. (Serbulent, U., et al., 2020)
Proteins are challenging to characterize because of their relatively large molecular weight, complex structure, and a high degree of non-homogeneity, requiring a wide range of technical expertise and resolution solutions. Creative Biostructure has a range of protein characterization analysis solutions that provide extensive and in-depth analysis of the structural, physicochemical, and functional aspects of proteins. Please feel free to contact us for project details.
Ordering Process

References
- Liu X R., et al. Mass spectrometry-based protein footprinting for higher-order structure analysis: fundamentals and applications. Chemical Reviews. 2020, 120(10): 4355-4454.
- Unsal S., et al. Evaluation of methods for protein representation learning: a quantitative analysis. BioRxiv. 2020: 2020.10. 28.359828.

