Nucleic acids are dynamic molecules whose functions rely on their three-dimensional structures. Circular Dichroism (CD) spectroscopy offers a rapid, sensitive, and accessible method to probe these structural features, providing insights into the secondary and tertiary conformations of DNA and RNA. From distinguishing DNA polymorphs to tracking RNA folding and characterizing G-quadruplex topologies, CD enables comprehensive analysis of nucleic acid structure and dynamics in solution, making it an essential tool in structural biology and therapeutic research.
What is the CD of Nucleic Acids?
The circular dichroism (CD) of nucleic acids offers a unique spectroscopic fingerprint, providing characteristic insights into their specific secondary structures. This powerful technique is particularly adept at detecting and monitoring structural changes that occur due to shifts in environmental conditions, such as alterations in temperature, ionic strength, or pH. By observing how these factors influence the differential absorption of circularly polarized light, researchers can gain a real-time understanding of nucleic acid folding, stability, and conformational transitions.
Why is CD Spectroscopy Crucial for Nucleic Acid Studies?
CD spectroscopy offers several compelling advantages for investigating nucleic acids:
- Sensitivity to Conformation: CD signals are highly sensitive to the secondary and tertiary structures of DNA and RNA. Subtle changes in helix geometry, base stacking, or the presence of non-canonical structures lead to distinct alterations in the CD spectrum.
- Non-Destructive and Relatively Fast: The technique is non-invasive, requiring small sample volumes (typically microliters) and allowing for rapid data acquisition. This makes it ideal for screening, kinetic studies, and monitoring changes over time.
- Information on Global Structure: While not providing atomic-resolution detail like NMR, X-ray crystallography, and Cryo-EM, CD gives valuable insights into the overall structural class and conformational transitions of nucleic acids in solution, under physiological conditions.
- Versatility: CD can be used to study a wide range of phenomena, including thermal stability, ligand binding, protein-nucleic acid interactions, and the influence of environmental factors.
Select Service
The Fundamentals of CD Spectroscopy Applied to Nucleic Acids
Principles of Chiroptical Spectroscopy
Differential Absorption of Left and Right Circularly Polarized Light
When plane-polarized light passes through a chiral sample, it becomes elliptically polarized. This occurs because chiral molecules absorb the left and right components of circularly polarized light to different extents. The circular dichroism signal results from this differential absorption and is defined as:
![]()
where AL and AR represent the absorbance of left and right circularly polarized light, respectively. This phenomenon is only observed within the molecule's electronic absorption bands—wavelength regions where the molecule absorbs light. For nucleic acids, these bands are typically in the ultraviolet (UV) range due to the electronic transitions of their nucleobases.
Molar Circular Dichroism (Δε)
The raw CD signal (ΔA) is often converted into molar circular dichroism, denoted as Δε, which is an intrinsic property of the molecule independent of concentration and path length. It is expressed in units of M−1·cm−1 and calculated using the modified Beer–Lambert Law:
where C is the molar concentration of the nucleic acid (typically per mole of nucleotide), and 𝑙 is the path length of the cuvette in centimeters.
In many cases, particularly when comparing different types of nucleic acids or working with complex samples, CD data are also reported as mean residue ellipticity, denoted by [𝜃]. This form of data presentation is useful when exact molar concentrations are difficult to determine. The conversion from molar circular dichroism to mean residue ellipticity is given by:
![]()
with units of deg·cm2 ·dmol−1.
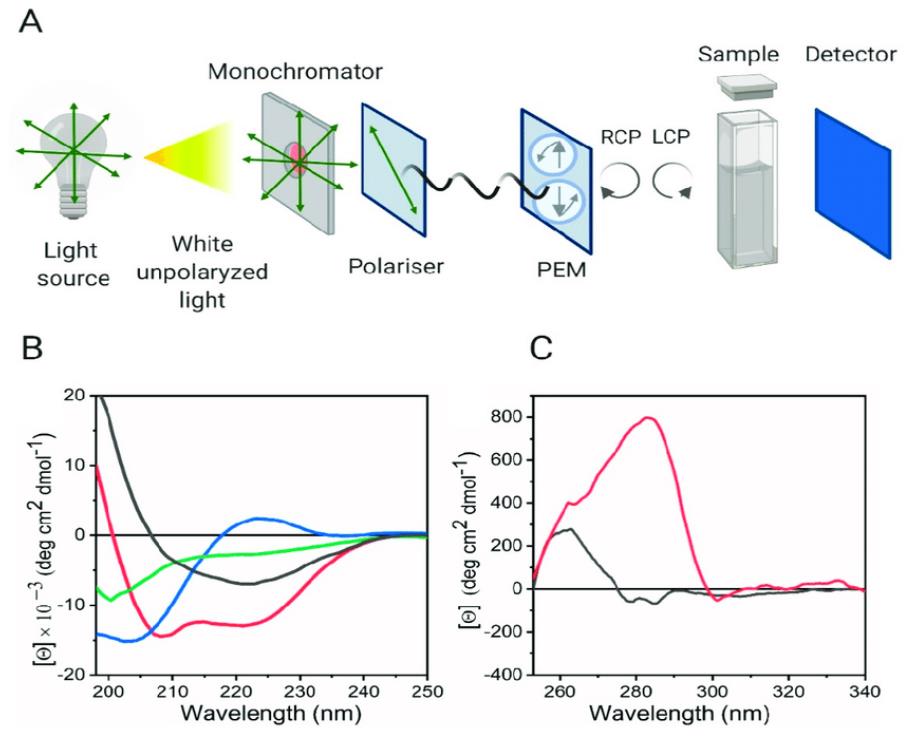
Instrumentation for CD Spectroscopy
A modern CD spectropolarimeter typically consists of several key components:
- Light Source (Xenon Arc Lamp): This provides a broadband, high-intensity light source in the UV-Vis range.
- Monochromator: Selects a specific wavelength of light to pass through the sample.
- Photoelastic Modulator (PEM): This is the heart of the CD instrument. It rapidly converts linearly polarized light into alternating left and right circularly polarized light at a high frequency (e.g., 50 kHz).
- Sample Cell: A quartz cuvette (typically 0.1 to 1 cm path length) holds the nucleic acid sample.
- Detector (Photomultiplier Tube): Measures the light intensity transmitted through the sample. The detector measures the difference in absorption between the alternating left and right circularly polarized light components.
- Computer and Software: Controls the instrument, collects data, and processes the spectra.
Experimental Setup and Considerations for Nucleic Acid Samples
Proper experimental setup is paramount for obtaining high-quality and interpretable CD spectra of nucleic acids.
- Sample Preparation (Concentration, Purity, Buffer): Nucleic acid samples must be highly pure, free from protein contaminants or aggregates that can cause light scattering. Concentration is critical; samples should be in the low micromolar to tens of micromolar range (based on nucleotide concentration) to ensure measurable signals without saturating the detector. The choice of buffer is equally important. Buffers must be transparent in the UV region (e.g., phosphate buffer, Tris buffer) and often contain salts (e.g., NaCl, KCl) to mimic physiological conditions and promote stable secondary structures.
- Temperature Control and Its Importance: Temperature significantly influences nucleic acid conformation. CD instruments often incorporate peltier-controlled cuvette holders, allowing precise temperature regulation. This is crucial for studying thermal melting curves and understanding the stability of nucleic acid structures.
- Wavelength Range for Nucleic Acid Analysis (190-320 nm): The diagnostically relevant CD signals for nucleic acids primarily arise from the electronic transitions of their nitrogenous bases, which absorb strongly in the UV region, particularly between 200 nm and 300 nm. The far-UV region (190-200 nm) can also provide information, but solvent and buffer absorption become significant. For most nucleic acid studies, scanning from approximately 320 nm down to 200 nm (or lower if possible) is common.
CD Spectroscopy for DNA Conformation and Dynamics
CD spectroscopy is a fundamental tool for analyzing the structural diversity of DNA. Its spectra are highly sensitive to secondary structural features such as helical handedness, base stacking, and glycosidic bond conformations.
Canonical DNA Forms and Their Distinct CD Signatures
B-DNA: Characteristic Positive and Negative Bands
The vast majority of DNA in physiological conditions exists as B-DNA, a right-handed double helix. Its canonical CD spectrum is highly recognizable: a positive peak around 275-280 nm and a negative peak around 245 nm. The intensity of these bands is proportional to the number of base pairs and is influenced by sequence and base stacking. This signature serves as a reference for assessing deviations from the standard B-form.
A-DNA: Unique CD Spectra in Dehydrating Conditions
Under dehydrating conditions (e.g., high ethanol concentrations or in certain DNA-protein complexes), DNA can adopt the A-DNA conformation, which is also a right-handed helix but is wider and more compact than B-DNA, with a deeper major groove. The CD spectrum of A-DNA is distinctly different from B-DNA, typically showing a stronger positive band around 260-270 nm and a negative band shifted to longer wavelengths, around 210-220 nm. The changes in base inclination and stacking geometry are responsible for these spectral differences.
Z-DNA: Inverted CD Signals
Z-DNA is a striking departure from the right-handed helices. It is a left-handed double helix, often induced by specific sequences (e.g., alternating purine-pyrimidine tracts like poly(dG-dC)) or high salt concentrations. Its CD spectrum is remarkably distinct, featuring inverted signals compared to B-DNA: a negative band around 290 nm and a positive band around 260 nm. This inverted spectrum is a hallmark of the left-handed twist and altered backbone conformation.
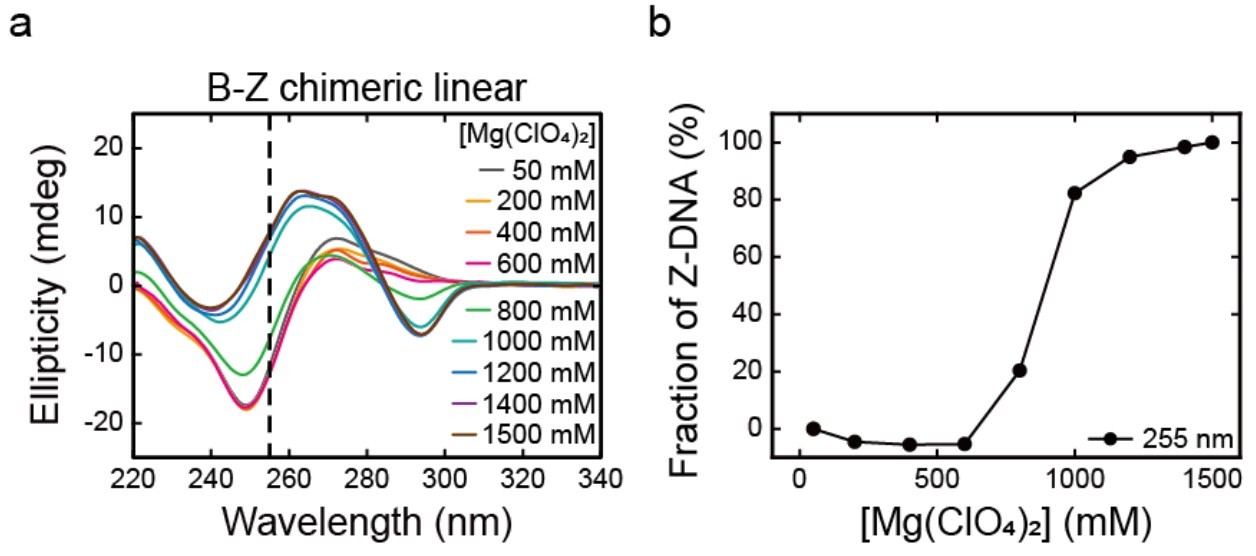 Figure 1. Circular Dichroism Analysis of B-Z Transition in Chimeric DNA. (a) CD spectra of B-Z chimeric linear DNA at varying Mg(ClO₄)₂ concentrations, showing the B-to-Z transition, with 255 nm as a reference point. (b) Z-DNA fraction calculated from CD signal changes at 255 nm, demonstrating salt-dependent Z-DNA formation. The transition midpoint differs from single-molecule measurements due to residual B-DNA. (Yi J, et al., 2022)
Investigating Conformational Polymorphism of DNA
Circular dichroism and conformational polymorphism of DNA go hand-in-hand. CD spectroscopy is exceptionally useful for probing the dynamic transitions between these different DNA forms and the factors that influence them.
- Impact of Environmental Factors (Salts, Solvents): Changes in ionic strength, pH, and the presence of organic solvents can induce conformational transitions in DNA. CD can quantitatively monitor these transitions, such as the B-to-Z transition induced by increasing salt concentrations or the B-to-A transition in ethanol solutions.
- DNA-Protein Interactions and Conformational Changes: Many proteins recognize and bind to specific DNA sequences, often inducing or stabilizing particular DNA conformations. CD can detect these subtle (or dramatic) conformational changes in the DNA upon protein binding, providing insights into the mechanism of recognition.
- DNA-Ligand Binding and the Monitoring of Structural Adaptations: Small molecules, including drugs and intercalators, often bind to DNA, leading to structural perturbations. Circular dichroism DNA studies can reveal whether a ligand induces a change in DNA's overall helical structure, unwinding, or condensation. Changes in the DNA's intrinsic CD bands, or the appearance of induced CD bands if the ligand is achiral but becomes chiral upon binding, provide valuable information on the interaction.
Studying Non-Canonical DNA Structures
Beyond the classic A, B, and Z forms, DNA can adopt a variety of non-canonical structures with crucial biological roles. CD spectroscopy is an excellent tool for their characterization.
G-Quadruplex DNA: Distinctive CD Signatures for Parallel, Antiparallel, and Mixed Topologies
G-quadruplex circular dichroism represents a highly active area of research. G-quadruplexes (G4s) are four-stranded DNA structures formed by guanine-rich sequences. Their CD spectra are highly sensitive to structural topology.
Parallel G4s, such as those formed by human telomeric sequences in the presence of sodium ions (Na⁺), typically exhibit a positive peak around 260 nm and a negative peak near 240 nm.
Antiparallel G4s, such as those stabilized by potassium ions (K⁺), display a positive peak around 295 nm and a negative peak near 260 nm.
Mixed or hybrid topologies show features of both, often with a positive peak around 260 nm, an additional positive peak near 290 nm, and a negative peak near 240 nm.
CD spectroscopy is often the first and most rapid method used to confirm G4 formation and distinguish among topological types.
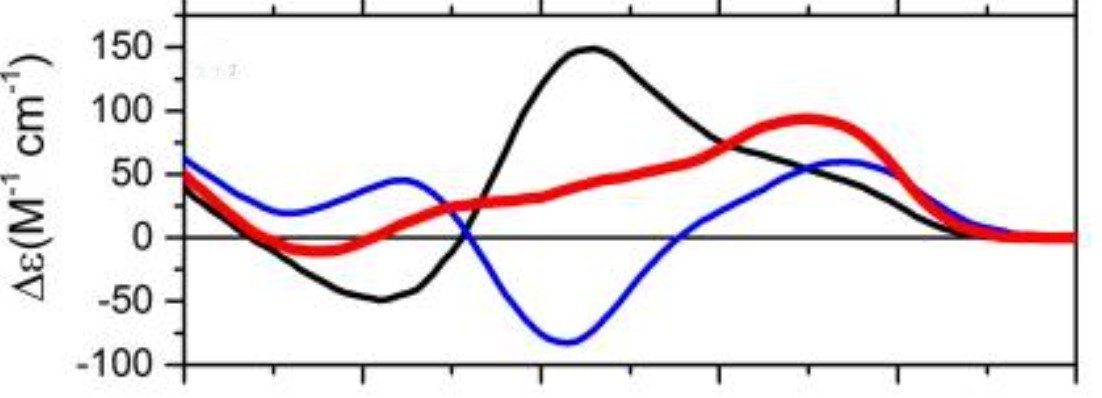 Figure 2. CD Spectral Features of Human Telomeric G-Quadruplex Conformations. Circular dichroism spectra of human telomeric G-quadruplexes showing distinct signatures for the antiparallel basket form (blue, in sodium), hybrid form (red, in potassium), and parallel propeller form (black, in 50% acetonitrile). (del Villar‐Guerra R, et al., 2017)
i-Motif Structures: pH-Dependent CD Changes
i-Motifs are four-stranded DNA structures formed by cytosine-rich sequences and are typically stable under acidic conditions. Their formation is associated with a positive CD band between 285 and 290 nm and a negative band near 260 nm, both of which are strongly dependent on pH.
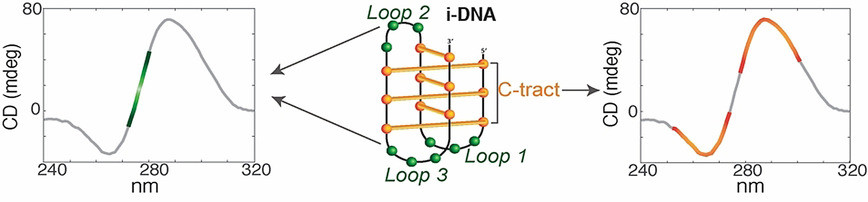 Figure 3. Spectral Signatures for Structural Identification of i-DNA. i-DNA, a non-canonical DNA secondary structure with therapeutic relevance, shows distinct TDS and CD spectral features. (Iaccarino N, et al., 2021)
Cruciform DNA and Other Hairpin Structures Detected by CD
Although their CD signatures are less distinct than those of G-quadruplexes, cruciform and hairpin structures can still be effectively monitored using CD spectroscopy. Cruciforms, which arise from inverted repeats, and other stem-loop-based structures often show detectable changes in overall helical content that are reflected in their CD spectra.
CD Spectroscopy Applied to RNA Structure and Folding
As with DNA, RNA circular dichroism is essential for understanding the diverse structural and functional roles of RNA. CD studies provide valuable insights into the folding pathways and conformational dynamics of RNA molecules.
Elucidation of RNA Secondary Structure Using CD
Unlike DNA, which primarily forms B-type helices, RNA generally adopts an A-form helical geometry.
A-form Helices in RNA and Their Comparison to A-DNA
The CD spectrum of double-stranded RNA (dsRNA) is characterized by a strong positive peak around 265 to 270 nm and a negative peak near 210 nm. This pattern resembles that of A-DNA, reflecting their shared helical geometry, although differences in intensity and spectral features arise due to the 2'-hydroxyl group and the use of uracil instead of thymine in RNA.
Hairpins, Bulges, and Internal Loops and Their Subtle CD Contributions
While the CD spectrum of RNA is dominated by signals from helical regions, structural motifs such as hairpins, bulges, and internal loops can also influence the spectral profile. These effects may be subtle, but changes in their formation or disruption can be detected through CD measurements.
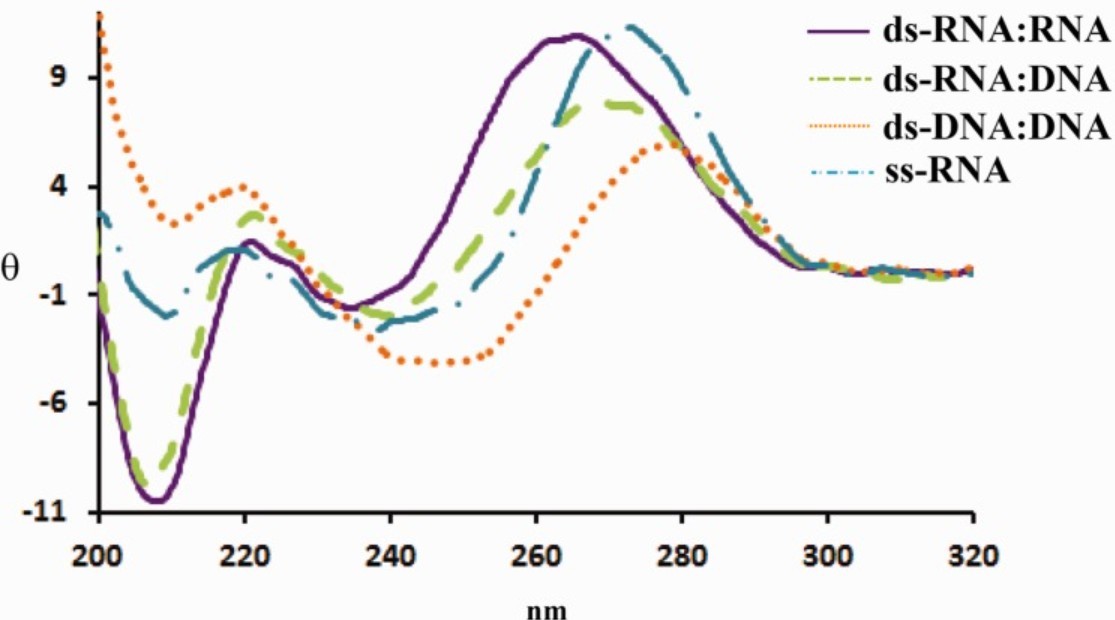 Figure 4. CD Spectra of Canonical Nucleic Acid Duplexes and Single-Stranded RNA. Circular dichroism spectra of dsRNA:RNA, RNA:DNA, DNA:DNA, and ssRNA (complement 6), measured at 25 μM in buffer containing 5 mM MgCl₂, 10 mM NaCl, and 1 mM sodium phosphate (pH 7.2). (Chauca‐Diaz A M, et al., 2015)
Monitoring RNA Tertiary Structure and Folding Pathways with CD
RNA folding progresses hierarchically from its primary sequence to secondary structures, and eventually to complex tertiary configurations. CD spectroscopy provides an effective approach for tracking this process.
Cation-Induced Folding and Its Detection by CD
Divalent cations such as magnesium ions (Mg²⁺) play a key role in stabilizing RNA tertiary structures. CD spectroscopy can monitor the conformational changes that occur as RNA folds into its functional state in the presence of these ions. These changes are often observed as shifts in peak intensities or spectral positions.
Thermal Denaturation Studies of RNA
Similar to DNA, circular dichroism RNA secondary structure stability can be assessed by performing thermal melting experiments. By monitoring the CD signal as a function of temperature, one can determine the melting temperature (Tₘ) of RNA helices, providing insights into their thermodynamic stability. This is a common method to compare the stability of different RNA constructs or the impact of mutations.
Studying Specific RNA Molecules
- tRNA and rRNA: Transfer RNAs (tRNAs) and ribosomal RNAs (rRNAs) have well-defined and complex tertiary structures essential for their biological functions. CD can provide a quick assessment of their overall folded state, confirming the presence of characteristic tertiary contacts.
- mRNA and ncRNA: Messenger RNAs (mRNAs) and non-coding RNAs (ncRNAs) are increasingly recognized for their structural roles in gene regulation. CD can be used to study their conformational dynamics, such as changes induced by ligand binding, protein interactions, or post-transcriptional modifications.
Select Service
Related Reading
Circular Dichroism of Aptamers
Aptamers are single-stranded nucleic acids (DNA or RNA) that can bind to specific targets with high affinity and specificity, often adopting unique three-dimensional structures upon target recognition.
- Characterizing Aptamer Folding and Ligand Binding: CD is widely used to characterize the folding of aptamers into their active conformations. The unique CD signature of an aptamer's functional structure can be identified and used as a benchmark.
- Conformational Changes Upon Target Recognition: A critical application of CD in aptamer research is to monitor the conformational changes that occur in the aptamer upon binding to its specific target molecule (e.g., protein, small molecule, ion). Often, this binding event induces a significant alteration in the aptamer's secondary or tertiary structure, resulting in a detectable change in its CD spectrum. This provides direct evidence of specific binding and insights into the binding mechanism.
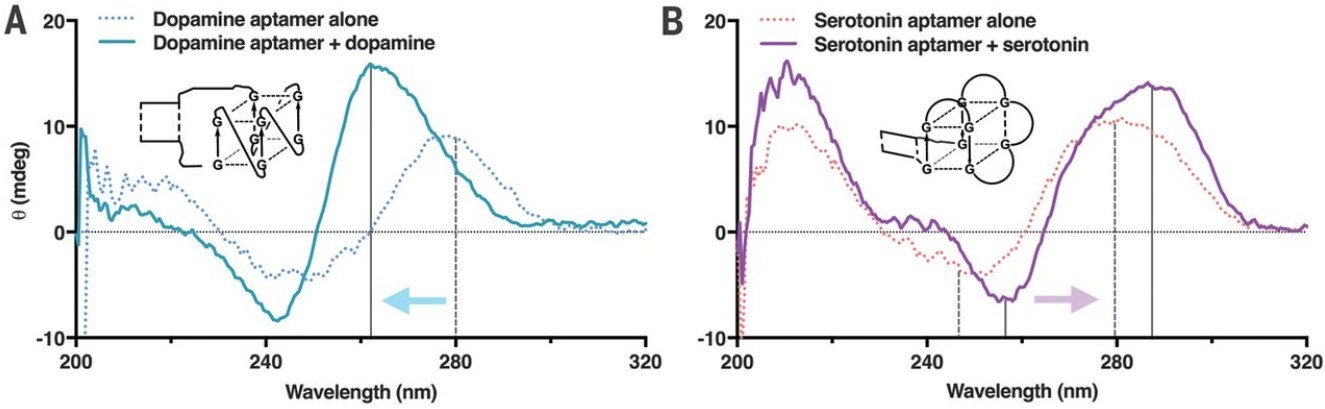 Figure 5. Structural Changes in Aptamers Upon Binding Small-Molecule Targets. (A) CD spectra of the dopamine aptamer reveal a shift toward parallel G-quadruplex formation upon binding in 1× aCSF. (B) The serotonin aptamer shows spectral changes consistent with antiparallel G-quadruplex formation upon ligand binding. (Nakatsuka N, et al., 2018)
Advanced Applications and Emerging Trends
The application of CD spectroscopy goes beyond basic structural analysis and includes dynamic and specialized studies of nucleic acid behavior.
Thermal CD Melting Curves for Nucleic Acid Stability
Thermal CD melting curves are widely used to evaluate nucleic acid stability. By recording CD spectra over a range of increasing temperatures, the unfolding of nucleic acid structures can be monitored in real time. The midpoint of this transition is defined as the melting temperature (Tₘ), which reflects the thermal stability of the molecule.
Further analysis of these curves enables the calculation of key thermodynamic parameters, including enthalpy (ΔH), entropy (ΔS), and Gibbs free energy (ΔG). These values offer quantitative insight into the energetics of nucleic acid folding and unfolding processes.
Stopped-Flow CD for Kinetic Analysis of Nucleic Acid Folding
For studying fast conformational changes, stopped-flow CD provides a solution. This technique rapidly mixes reactants (e.g., nucleic acid and ligand, or denaturant) and then immediately passes the mixture into a CD cuvette, allowing for real-time monitoring of conformational transitions on timescales from milliseconds to minutes. This is invaluable for elucidating the kinetics and pathways of nucleic acid folding and unfolding.
Synchrotron Radiation Circular Dichroism (SRCD)
SRCD leverages the high brilliance, intensity, and broadband nature of synchrotron light sources.
- Enhanced Signal-to-Noise Ratio for Low Concentration Samples: The high photon flux of synchrotron light allows for high-quality CD data to be collected even from very dilute samples (low micromolar or even nanomolar concentrations), which is particularly beneficial for scarce or aggregation-prone nucleic acids.
- Far-UV and Vacuum UV Applications: SRCD extends the accessible wavelength range further into the vacuum UV (VUV) region (below 190 nm). This region contains additional electronic transitions of nucleic acid bases and backbone atoms, potentially providing more detailed conformational information that is inaccessible with conventional lab-based instruments.
Chiral Nanomaterials and Nucleic Acid Interactions
- DNA-Wrapped Carbon Nanotubes Show Induced Circular Dichroism: Even achiral or racemic single-walled carbon nanotubes (SWCNTs) can exhibit circular dichroism when wrapped with DNA. The chiral helical wrapping of the DNA around the SWCNT induces a chirality in the otherwise achiral nanotube structure, leading to a measurable CD signal. This phenomenon has implications for biosensing and the development of novel chiroptical materials.
- Plasmon-Enhanced CD of Nucleic Acids: Interactions between nucleic acids and metallic nanoparticles can lead to plasmon-enhanced CD signals. The localized surface plasmon resonance (LSPR) of noble metal nanoparticles can amplify the intrinsic CD signals of nearby chiral molecules, offering a potential route for ultrasensitive detection of nucleic acids or monitoring their conformational changes.
Advantages and Limitations of CD Spectroscopy in Nucleic Acid Studies
| Category | Aspect | Description |
|---|---|---|
| Advantages | Non-destructive and Fast | Enables rapid screening and dynamic monitoring without permanently altering the sample. |
| Sensitive to Chiral Conformation | Detects overall three-dimensional features such as helical handedness, base stacking, and global folding. | |
| Low Sample Volume Requirement | Requires only microliters of sample, conserving valuable materials. | |
| Provides Global Structural Information | Captures the dominant conformation in solution without the need for crystallization or labeling. | |
| Broad Applicability | Applicable to DNA, RNA, DNA-RNA hybrids, and various non-canonical structures like G-quadruplexes or i-motifs. | |
| Limitations | Lacks Atomic-Level Resolution | Offers ensemble-averaged data without details of specific bonds or interactions; must be complemented by techniques like NMR or X-ray crystallography. |
| Signal Overlap in Complex Samples | CD signals can overlap in mixed systems, making interpretation difficult in large or heterogeneous assemblies. | |
| Susceptibility to Scattering Artifacts | Aggregates or particulates can distort CD spectra; careful sample preparation is necessary. | |
| Limited Detection of Subtle Structural Changes | Minor local changes may not produce clear spectral differences, reducing its effectiveness in detecting fine-scale conformational shifts. |
Highlights of CD Spectroscopy in DNA and RNA Research
CD has made significant contributions to:
- Identifying and quantifying different DNA and RNA helical forms.
- Monitoring thermal stability and denaturation of nucleic acids.
- Investigating ligand-nucleic acid and protein-nucleic acid interactions.
- Characterizing the folding and structural dynamics of aptamers and non-coding RNAs.
- Confirming the formation and topology of diverse non-canonical structures like G-quadruplexes and i-motifs.
At Creative Biostructure, we offer precise and reliable analysis of DNA and RNA structure, stability, and interactions. Whether you are studying conformational polymorphism, RNA folding, aptamer behavior, or G-quadruplex formation, our CD spectroscopy services are designed to support your research goals. We can combine CD with complementary techniques such as NMR, X-ray crystallography, and Cryo-EM, along with computational tools like molecular dynamics simulations and spectral modeling, to provide a comprehensive view of nucleic acid structure and function. Contact us to learn how our expertise can help advance your nucleic acid research.
References
- Martin S R, Schilstra M J. Circular dichroism and its application to the study of biomolecules. Methods in Cell Biology. 2008, 84: 263-293.
- Lee M, Kim S H, Hong S C. Minute negative superhelicity is sufficient to induce the BZ transition in the presence of low tension. Proceedings of the National Academy of Sciences. 2010, 107(11): 4985-4990.
- Vorlíčková M, Kejnovská I, Bednářová K, et al. Circular dichroism spectroscopy of DNA: from duplexes to quadruplexes. Chirality. 2012, 24(9): 691-698.
- Chang Y M, Chen C K M, Hou M H. Conformational changes in DNA upon ligand binding monitored by circular dichroism. International Journal of Molecular Sciences. 2012, 13(3): 3394-3413.
- Chauca‐Diaz A M, Jung Choi Y, Resendiz M J E. Biophysical properties and thermal stability of oligonucleotides of RNA containing 7, 8‐dihydro‐8‐hydroxyadenosine. Biopolymers. 2015, 103(3): 167-174.
- del Villar‐Guerra R, Gray R D, Chaires J B. Characterization of quadruplex DNA structure by circular dichroism. Current Protocols in Nucleic Acid Chemistry. 2017, 68(1): 17.8. 1-17.8. 16.
- Nakatsuka N, Yang K A, Abendroth J M, et al. Aptamer-field-effect transistors overcome Debye length limitations for small-molecule sensing. Science. 2018, 362(6412): 319-324.
- Scott P, Garcia-Santiago X, Beutel D, et al. On enhanced sensing of chiral molecules in optical cavities. Applied Physics Reviews. 2020, 7(4).
- Iaccarino N, Cheng M, Qiu D, et al. Effects of Sequence and Base Composition on the CD and TDS Profiles of i‐DNA. Angewandte Chemie International Edition. 2021, 60(18): 10295-10303.
- Yi J, Yeou S, Lee N K. DNA bending force facilitates Z-DNA formation under physiological salt conditions. Journal of the American Chemical Society. 2022, 144(29): 13137-13145.
- Kerler Y, Sass S, Hille C, et al. Determination of aptamer structure using circular dichroism spectroscopy. Nucleic Acid Aptamers: Selection, Characterization, and Application. New York, NY: Springer US, 2022: 119-128.