Circular Dichroism (CD) spectroscopy is a powerful yet often overlooked technique for studying the structures of chiral molecules, particularly proteins and nucleic acids.
If you are beginning your exploration of structural biology or want to understand how molecular shapes are analyzed, this guide will help. It covers the basic principles of CD spectroscopy, how the instruments work, and the main applications of the method. It also provides practical advice on sample preparation, key experimental factors, and common troubleshooting tips to help you obtain accurate and meaningful results.
What is Circular Dichroism (CD) Spectroscopy?
Understanding Circular Dichroism
CD spectroscopy measures the difference in absorption between left and right circularly polarized light by a sample. Light is not only a wave but also has directionality in its oscillations. In circularly polarized light, the electric field rotates in a helical pattern as the wave travels. There are two forms: left and right circularly polarized light, which are mirror images of each other.
While standard absorption depends on a molecule's overall ability to absorb light, CD focuses on whether one type of circularly polarized light is absorbed more than the other. This difference, known as circular dichroism, occurs only when the molecule is chiral.
The Role of Chirality
Chirality is essential to CD. A chiral molecule cannot be superimposed on its mirror image, similar to how your left and right hands are distinct. Many biological molecules, such as amino acids and sugars, are chiral and usually occur in only one form in nature. Proteins, composed of chiral amino acids arranged in specific sequences and folded into complex shapes, are strongly chiral.
This chirality gives rise to a detectable CD signal. In contrast, achiral molecules absorb left and right circularly polarized light equally and produce no CD signal. Because of this selectivity, CD spectroscopy is a powerful method for analyzing the structure and conformational changes of biological macromolecules.
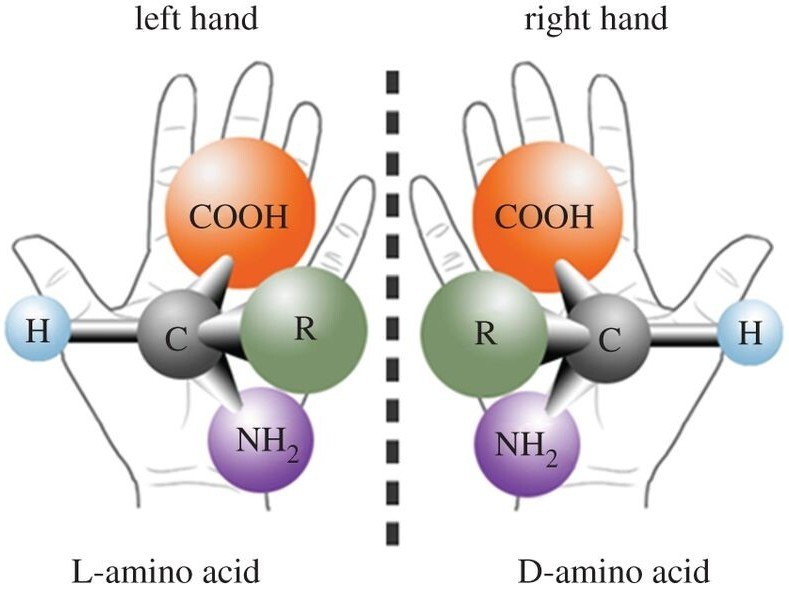 Figure 1. Chirality refers to the geometric property where an object cannot be superimposed on its mirror image, exemplified by left and right hands. Many biological molecules, including amino acids, exhibit chirality. (Inaki M, et al., 2016)
The Principle of Circular Dichroism Spectroscopy
What Is Circularly Polarized Light?
To grasp the principle of CD spectroscopy, let's first clarify circularly polarized light. Unlike linear polarized light, which oscillates in a single plane, circularly polarized light's electric field vector rotates as it moves through space, forming a helix. This rotation can be either clockwise (right circularly polarized) or counter-clockwise (left circularly polarized).
The Interaction of Circularly Polarized Light with Chiral Molecules
When left and right circularly polarized light pass through a chiral molecule, they interact differently with the molecule's electrons. Because the molecule's arrangement of atoms lacks mirror symmetry, the electrons "see" the two forms of light slightly differently. This leads to a measurable difference in their absorption.
Specifically, circular dichroism (CD) measures the difference in absorption coefficient (∆A) between left (AL) and right (AR) circularly polarized light:
∆A=AL-AR
This differential absorption is typically measured in the ultraviolet (UV) region of the electromagnetic spectrum, as this is where the electronic transitions of common biomolecular chromophores (like the peptide bonds in proteins or bases in nucleic acids) occur.
Electronic Transitions and the CD Signal
The CD signal arises from the electronic transitions within the chiral molecule. For proteins, the primary chromophores responsible for the far-UV CD signal (190-250 nm) are the peptide bonds, which exhibit n-π∗and π-π∗transitions. The specific secondary structure (e.g., alpha-helix, beta-sheet, random coil) dictates the orientation of these peptide bonds, and thus their interaction with circularly polarized light, producing characteristic CD spectra. For example, alpha-helices typically show distinct double minima at 208 nm and 222 nm, while beta-sheets often have a minimum around 218 nm and a maximum near 195 nm.
Visualizing the Process: Circular Dichroism Diagrams
Imagine a circular dichroism spectroscopy diagram where unpolarized light first passes through a linear polarizer and then a photoelastic modulator. This modulator rapidly switches between generating left and right circularly polarized light. This alternating light then passes through your sample, and the differential absorption is detected. The resulting spectrum plots the CD signal (usually in ellipticity, a measure related to differential absorption) against wavelength.
Inside the CD Spectrometer: Instrumentation Overview
Key Components of a Circular Dichroism Spectrometer
A typical circular dichroism spectrometer consists of several essential components working in harmony to generate and detect the minute CD signal:
- Light Source: Usually a high-intensity xenon arc lamp, producing light across a broad UV-visible range.
- Monochromator: Selects a specific wavelength of light to pass through the sample, scanning across the desired spectral range.
- Polarizer: Converts the unpolarized light from the monochromator into linearly polarized light.
- Photoelastic Modulator (PEM): This is the heart of the CD instrument. It converts the linearly polarized light into rapidly alternating left and right circularly polarized light by applying an oscillating stress to an optical element (like a quartz block).
- Sample Compartment: Where your sample, typically in a specialized cuvette, is placed.
- Detector (Photomultiplier Tube - PMT): Measures the intensity of the light transmitted through the sample.
- Electronics and Computer System: Processes the difference in light absorption between the left and right circularly polarized light beams, converting it into a CD signal (usually expressed in millidegrees of ellipticity or molar ellipticity).
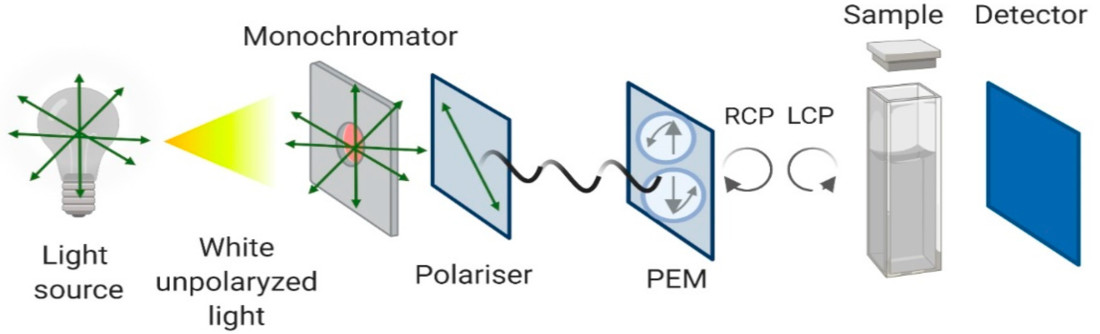 Figure 2. Schematic Configuration of a Circular Dichroism Spectrometer. (Pignataro M F, et al., 2020)
Essential Accessories: Cuvettes and High Voltage Considerations
Choosing the right circular dichroism cuvette is critical. These are typically made of quartz to ensure transparency in the UV range (especially below 200 nm). Pathlengths can vary from 0.01 cm (for highly concentrated samples) to 1.0 cm (for dilute samples). The selection depends directly on your sample concentration and the desired signal strength.
You might also encounter circular dichroism HT voltage (High Tension voltage) in the instrument's software. This voltage is applied to the photomultiplier tube (PMT) detector. A higher HT voltage increases the detector's sensitivity but also its noise. If your HT voltage is consistently very high (e.g., nearing maximum limits, like 600-700V depending on the instrument), it suggests very low light throughput, possibly due to a very dilute sample, a dirty lamp, or a highly absorbing buffer, which can compromise data quality.
Applications of Circular Dichroism
The applications of circular dichroism are incredibly diverse, particularly in biochemistry and biophysics. It's an indispensable technique for characterizing chiral molecules, especially proteins and nucleic acids.
Unraveling Protein Secondary Structure
One of the most widespread circular dichroism uses is determining the secondary structure content of proteins. As mentioned, different secondary structural elements (alpha-helices, beta-sheets, turns, and random coils) have distinct CD spectral signatures in the far-UV region (190-250 nm). By analyzing the protein's CD spectrum, researchers can estimate the percentage of each secondary structure present. This provides quick insights into whether a protein is properly folded, misfolded, or has undergone conformational changes.
Monitoring Protein Folding, Unfolding, and Stability
CD spectroscopy is excellent for observing protein folding and unfolding events. Changes in temperature, pH, or the presence of denaturants will alter a protein's secondary structure, leading to changes in its CD spectrum. By monitoring the CD signal at a specific wavelength as a function of these variables, one can determine a protein's melting temperature (Tm) or its stability under various conditions. This is crucial for protein engineering, drug development, and understanding protein aggregation.
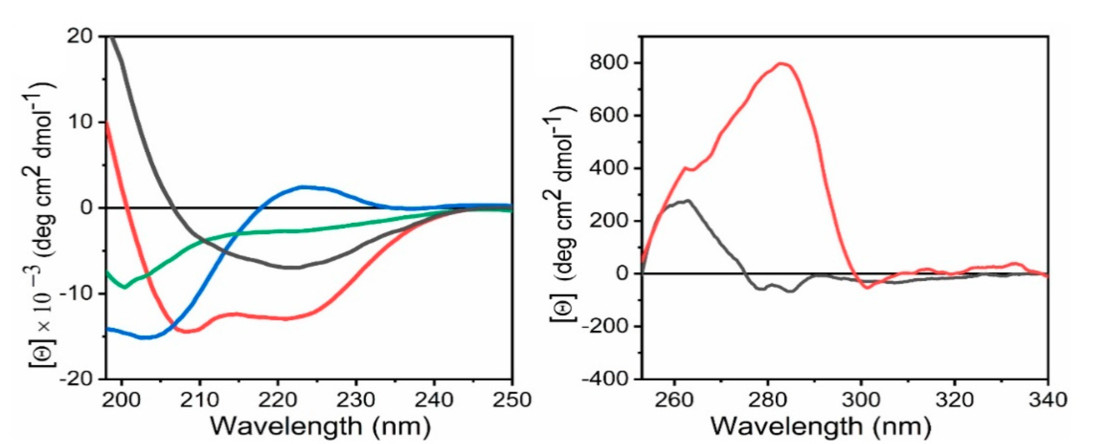 Figure 3. Representative Far-UV and Near-UV CD Spectra of Protein Secondary and Tertiary Structures. (L) Far-UV circular dichroism (CD) spectra showing characteristic patterns of protein secondary structures: random coil (green), α-helix (red), β-sheet (black), and polyproline II (blue). (R) Near-UV CD spectra of proteins illustrating tertiary structure environments: one with both tryptophan and tyrosine (red), and one with only tyrosine residues (black). (Pignataro M F, et al., 2020)
Investigating Ligand Binding and Conformational Changes
When a protein binds to a ligand (like a drug candidate or another protein), it often undergoes subtle or significant conformational changes. These changes can be detected by CD spectroscopy if they affect the protein's secondary or tertiary structure. This makes CD a valuable tool for screening drug candidates, understanding molecular recognition, and studying protein-protein or protein-DNA interactions.
Select Service
Beyond Proteins: Applications in Nucleic Acids and Small Molecules
While proteins are common subjects, CD spectroscopy is also widely used for:
- Nucleic Acids: DNA and RNA possess intrinsic chirality due to their sugar-phosphate backbone and stacked bases. CD can distinguish between different DNA conformations (e.g., A-form, B-form, Z-form) and monitor their transitions, as well as study RNA folding and interactions.
- Small Chiral Molecules: Determining the absolute configuration of newly synthesized chiral compounds in organic chemistry and pharmaceutical research.
- Polysaccharides and Polymers: Investigating the conformation of chiral polymers.
Select Service
Related Reading
- CD Spectroscopy for DNA and RNA: A Practical Tool for Structural and Stability Studies
- Magnetic Circular Dichroism (MCD) Spectroscopy Principles, Techniques, and Applications
- CD vs. ORD Spectroscopy: Key Differences in Analyzing Molecular Chirality
- Nucleic Acid Structure
- Carbohydrate Structure Overview
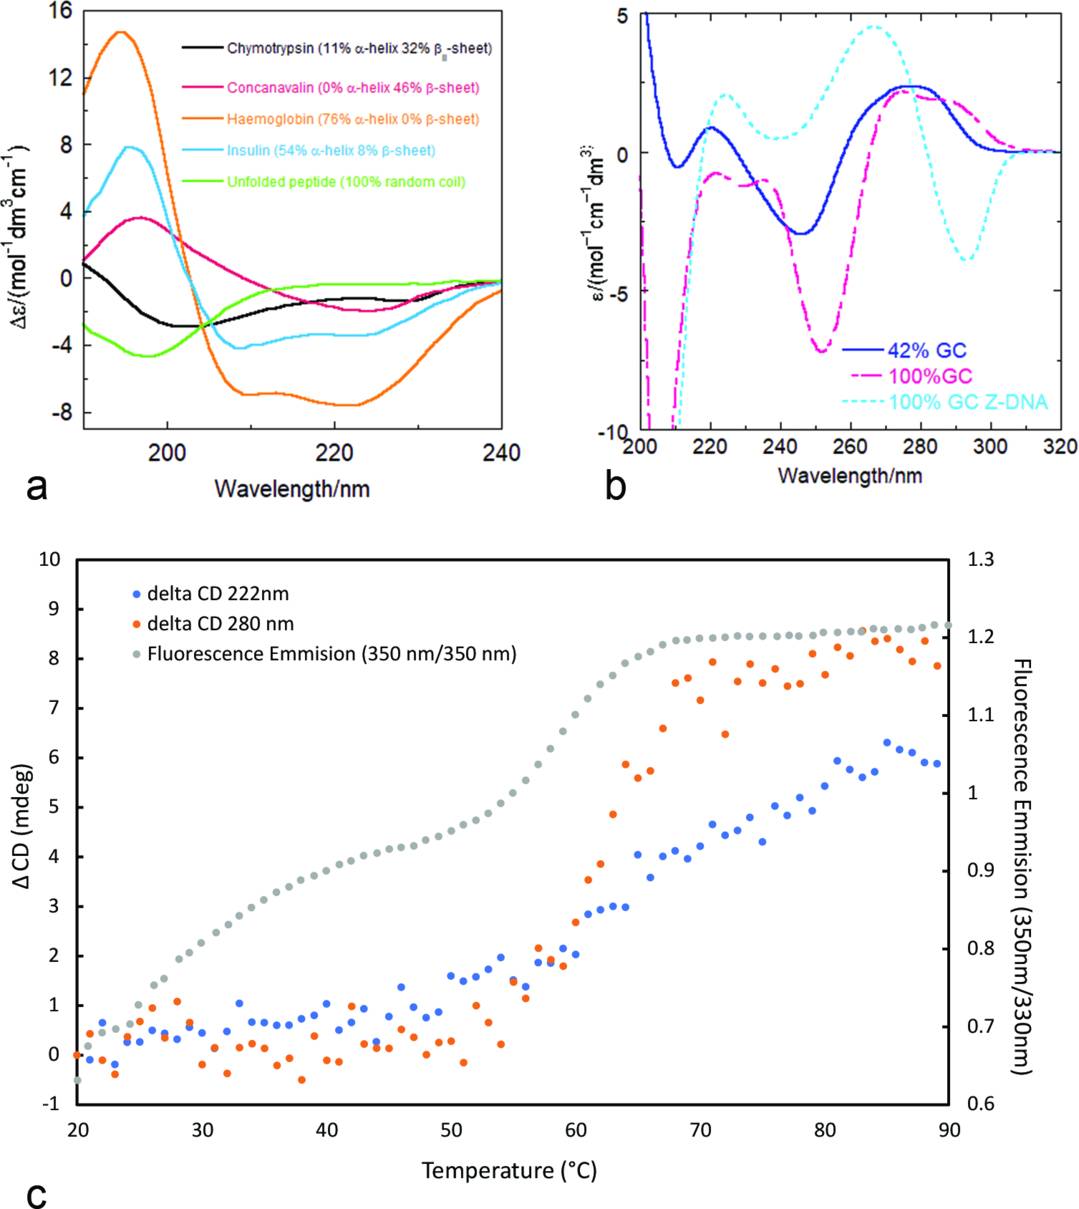 Figure 4. CD Spectral Signatures and Thermal Unfolding of Biomolecules. (a) CD spectra in the far-UV region for proteins with varying secondary structures. (b) CD spectra of DNA samples with different GC content, including Z-DNA induced by spermine. (c) Melting profiles of α-lactalbumin monitored by CD at two wavelengths and by fluorescence (350/330 nm intensity ratio). (Rodger A, et al., 2021)
Experimental Design and Sample Preparation for CD Measurements
Achieving high-quality, interpretable CD data heavily relies on meticulous experimental design and sample preparation for CD. Many troubleshooting issues stem from this stage.
General Considerations for CD Experiments
Before you even touch your sample, consider these points for how to measure circular dichroism:
- Purity: Your sample should be as pure as possible. Contaminants (especially other proteins, nucleic acids, or absorbing impurities) can significantly interfere with your CD signal.
- Concentration: The optimal circular dichroism concentration is crucial. Too dilute, and your signal will be weak and noisy. Too concentrated, and the sample will absorb too much light, leading to saturation and poor signal-to-noise ratio. For far-UV CD of proteins, concentrations typically range from 0.1 to 1.0 mg/mL, adjusted based on cuvette pathlength. For near-UV CD (tertiary structure), higher concentrations (1-5 mg/mL) are often needed.
- Buffer Background: The buffer components themselves can absorb UV light, especially at lower wavelengths, masking your protein's signal. Always run a "buffer blank" spectrum with just your buffer in the same cuvette to subtract its contribution.
- Temperature Control: CD is sensitive to temperature. If studying stability or kinetics, precise temperature control is essential.
- Pathlength: Choose your circular dichroism cuvette pathlength based on your sample's concentration and expected absorbance. For example, a 0.1 cm cuvette is often used for proteins at 1 mg/mL, while a 1 cm cuvette might be suitable for very dilute samples.
Sample Preparation Essentials: Concentration, Buffers, and pH
This section is vital for successful circular dichroism sample preparation.
- Concentration Determination: Accurately determine your sample's concentration (e.g., using UV-Vis spectrophotometry at 280 nm for proteins with known extinction coefficients, or BCA/Bradford assays). Inaccurate concentration is a common source of error.
- Buffer Choice: The right circular dichroism buffer is paramount.
Avoid highly absorbing buffers: Tris, imidazole, DTT, and high concentrations of NaCl absorb strongly in the far-UV and should be avoided or used at very low concentrations. Phosphate buffers, low concentrations of sodium chloride, and potassium fluoride are generally good choices for the far-UV.
Minimize additives: Glycerol (used as a cryoprotectant or for stabilization), urea, guanidinium chloride, and detergents, while sometimes necessary, can have their own CD signals or strong UV absorbance, especially at higher concentrations. Use them only when absolutely necessary and always run a buffer blank with the exact same composition.
Chloride ions circular dichroism: High concentrations of chloride ions (Cl−) can cause a positive CD signal below 200 nm, interfering with protein spectra. This is why some protocols recommend using fluoride salts (e.g., NaF or KF) instead of NaCl for studies below 200 nm, or keeping salt concentrations very low.
- pH of CD spectroscopy: The pH of your sample can significantly influence protein conformation and thus its CD spectrum. Ensure your buffer maintains the desired pH accurately. pH changes can induce structural transitions that are detectable by CD.
- Filtration/Centrifugation: Always filter or centrifuge your samples (and buffers!) just before measurement to remove any particulate matter, dust, or aggregates. These can scatter light and lead to noisy or distorted spectra.
Common Buffer Components and Their Impact on CD
Let's look at specific examples of components and their considerations:
- Glycerol circular dichroism: Often used to stabilize proteins or for low-temperature measurements. However, high concentrations can absorb significantly, especially below 200 nm, and can also increase viscosity, affecting diffusion.
- TCEP circular dichroism: Tris(2-carboxyethyl)phosphine (TCEP) is a common reducing agent. While less problematic than DTT, it can still absorb at very low wavelengths. Use the lowest effective concentration.
- Buffer circular dichroism: As stated, every buffer component has a UV cutoff. Ensure your buffer blank matches your sample buffer precisely.
- Detergents: If your protein requires detergents for solubility, be aware that many detergents (like SDS or Triton X-100) have their own strong UV absorbance and can induce secondary structure changes in proteins. Research specific CD-compatible detergents.
Limitations and Considerations of Circular Dichroism Spectroscopy
While a powerful technique, CD spectroscopy isn't without its limitations of circular dichroism. Understanding these helps in proper experimental design and data interpretation.
What CD Cannot Tell Us (and When Other Techniques are Needed)
- Atomic Resolution: CD spectroscopy provides information about overall secondary and tertiary structure but does not give atomic-level resolution of protein structure. For that, techniques like X-ray crystallography or NMR spectroscopy are required.
- Exact Secondary Structure Percentages: While CD can estimate the percentages of alpha-helix, beta-sheet, etc., these are estimations based on deconvolution algorithms and reference spectra. They are not absolute values.
- Specific Domain Information: If a protein has multiple domains, CD often provides an average structural picture of the entire molecule. It's difficult to isolate the structural changes in a single domain without other methods.
- Small Conformational Changes: Very subtle conformational changes might not produce a detectable CD signal, especially if they don't significantly alter the overall secondary or tertiary structure.
Troubleshooting
| Issue | Possible Causes | Troubleshooting Suggestions |
|---|---|---|
| Low Signal-to-Noise Ratio | - Sample too dilute - Dirty cuvette - Old lamp - High HT voltage - Too few scans |
- Increase sample concentration (if feasible) - Clean cuvette thoroughly - Replace old lamp - Reduce HT voltage by optimizing concentration - Increase scan repetitions |
| High HT Voltage | - Sample too concentrated - Absorbing buffer components - Particulates in sample - Instrument misalignment |
- Dilute sample - Change buffer components - Filter or centrifuge sample - Check instrument alignment (may require technician) |
| Distorted Spectra (< 200 nm) | - High absorbance from buffer or sample - Light scattering from aggregates or particulates - Air bubbles - Oxygen absorption (if not N₂-purged) |
- Match buffer in blank and sample - Filter or centrifuge samples - Degas buffers - Check nitrogen purge - Avoid chloride ions |
| Baseline Drift / Blank Issues | - Buffer blank does not match sample buffer - Temperature instability - Insufficient warm-up time |
- Use buffer blank prepared from same stock - Allow full warm-up of instrument - Maintain consistent temperature |
| Inconsistent Data | - Inaccurate concentration measurement - Sample degradation or aggregation - Temperature variation |
- Recheck concentration - Ensure sample integrity and avoid degradation - Keep temperature constant during measurement |
Synchrotron Radiation Circular Dichroism (SRCD) Spectroscopy
SRCD is an advanced form of CD spectroscopy that utilizes intense synchrotron-generated light to overcome many limitations of conventional instruments. By expanding the accessible wavelength range and improving sensitivity, SRCD enables more detailed and accurate structural characterization of biomolecules.
Advantages of SRCD over Conventional CD
While conventional CD spectroscopy remains a valuable tool for probing protein structures, SRCD spectroscopy significantly expands the technique's capabilities, especially when working with difficult samples or when higher-resolution structural data is needed.
Extended Wavelength Range
One of SRCD's most important advantages lies in its ability to probe deeper into the vacuum ultraviolet (VUV) region, often reaching down to ~170 nm or even lower. In contrast, conventional CD is typically limited to wavelengths above 190–200 nm. This extended range captures additional electronic transitions, providing richer spectral data and enabling more accurate determination of secondary structural elements, particularly in complex or noncanonical protein architectures.
Enhanced Light Intensity and Sensitivity
Synchrotron radiation is exponentially brighter than traditional xenon arc lamps, resulting in significantly improved signal-to-noise ratios. This allows:
- Lower sample concentrations: High-quality spectra can be collected from samples that are scarce, unstable, or difficult to purify in large quantities.
- Faster data acquisition: Shorter scan times accelerate experimental workflows and enable kinetic or temperature-dependent studies.
- Smaller sample volumes: The focused synchrotron beam permits measurements on microvolumes, conserving valuable material.
- Robustness in complex buffers: SRCD can tolerate components that absorb strongly in the UV (e.g., detergents for membrane proteins), where conventional CD performance would be compromised.
Key Applications of SRCD
The enhanced spectral resolution and sensitivity offered by SRCD make it especially well-suited for advanced structural biology applications:
- Refined secondary structure analysis: Access to deeper UV data enables more precise deconvolution of overlapping spectral features, improving quantification of alpha-helices, beta-sheets, and irregular structures.
- Characterization of intrinsically disordered proteins (IDPs): SRCD is ideal for detecting transient or flexible conformations in proteins that lack stable tertiary structure but play key biological roles.
- Membrane protein studies: Proteins solubilized in detergents or lipid mimetics can be analyzed with greater clarity due to SRCD's tolerance for UV-absorbing additives.
- Monitoring ligand binding and conformational dynamics: Subtle structural changes, even in dilute samples, can be sensitively detected, supporting drug discovery, protein-ligand interaction studies, and functional assays.
- High-throughput structural screening: In structural genomics and proteomics pipelines, SRCD enables rapid and accurate characterization of protein folds using minimal material, making it a powerful tool for large-scale efforts.
For biopharma applications of these principles, see CD Spectroscopy in Biopharma: Principles & Applications.
Conclusion: The Enduring Power of Circular Dichroism in Biological Research
Circular Dichroism spectroscopy stands as an exceptionally valuable and versatile biophysical technique. From rapidly assessing protein folding and secondary structure to monitoring dynamic processes like ligand binding and thermal denaturation, its ability to provide structural insights into chiral molecules, particularly biomacromolecules, is unparalleled for its speed and relative simplicity.
While it offers a lower resolution than techniques like X-ray crystallography or NMR spectroscopy, CD provides quick, informative, and often complementary data crucial for various stages of research, from protein expression screening to drug development and fundamental studies of molecular structure and function. Mastering the art of sample preparation and understanding the nuances of the technique are key to unlocking its full potential.
Curious to explore how CD spectroscopy can benefit your research projects? Or need expert assistance with your CD experiments or data interpretation? At Creative Biostructure, our specialists are ready to support your research through our comprehensive circular dichroism spectroscopy service. Don't hesitate to contact us to discuss your project needs or request a quote today.
References
- Greenfield N J. Using circular dichroism spectra to estimate protein secondary structure. Nature Protocols. 2006, 1(6): 2876-2890.
- Greenfield N J. Using circular dichroism collected as a function of temperature to determine the thermodynamics of protein unfolding and binding interactions. Nature Protocols. 2006, 1(6): 2527-2535.
- Kypr J, Kejnovská I, Renčiuk D, et al. Circular dichroism and conformational polymorphism of DNA. Nucleic Acids Research. 2009, 37(6): 1713-1725.
- Bertucci C, Pistolozzi M, De Simone A. Circular dichroism in drug discovery and development: an abridged review. Analytical and bioanalytical Chemistry. 2010, 398(1): 155-166.
- Inaki M, Liu J, Matsuno K. Cell chirality: its origin and roles in left–right asymmetric development. Philosophical Transactions of the Royal Society B: Biological Sciences. 2016, 371(1710): 20150403.
- Kumagai P S, Araujo A P U, Lopes J L S. Going deep into protein secondary structure with synchrotron radiation circular dichroism spectroscopy. Biophysical Reviews. 2017, 9: 517-527.
- Pignataro M F, Herrera M G, Dodero V I. Evaluation of peptide/protein self-assembly and aggregation by spectroscopic methods. Molecules. 2020, 25(20): 4854.
- Rodger A, Marshall D. Beginners guide to circular dichroism. Biochemist. 2021, 43(2): 58-64.