Circular Dichroism (CD) spectroscopy is a powerful method used to study the structure of chiral biomolecules like proteins. It works by detecting differences in how left and right circularly polarized light are absorbed. Far-UV CD reveals detailed information about a protein's secondary structure, such as alpha-helices and beta-sheets. Near-UV CD focuses on tertiary structure, highlighting changes around aromatic residues and disulfide bonds. Together, these techniques provide a comprehensive view of protein folding, stability, and conformational changes.
Why Use CD Spectroscopy for Protein Characterization?
CD spectroscopy offers several key advantages for protein characterization:
- Non-destructive and Solution-based: CD measurements can be performed on proteins in their native solution state, preserving their physiological relevance.
- High Sensitivity to Conformational Changes: Even subtle changes in protein secondary or tertiary structure can lead to measurable alterations in the CD spectrum.
- Low Sample Consumption: Often, only microgram quantities of protein are needed, making it suitable for precious samples.
- Kinetic Studies: Rapid data acquisition allows for real-time monitoring of protein folding, unfolding, and binding events.
- Versatility: Applicable across a wide range of protein sizes and types.
Introducing Far-UV and Near-UV CD in Protein Analysis
While both Far-UV CD and Near-UV CD fall under the umbrella of circular dichroism spectroscopy, they operate in distinct wavelength regions and provide unique, yet complementary, information about protein structure. Think of them as two different lenses, each revealing a specific aspect of the protein's overall architecture. Far-UV CD primarily informs us about the polypeptide backbone's conformation, specifically the arrangement of peptide bonds, which dictates the secondary structure. In contrast, Near-UV CD provides insights into the local environment of aromatic amino acids and disulfide bonds, shedding light on the intricate folds that define the tertiary structures.
Far-UV Circular Dichroism: Probing Secondary Structure Landscape
Principles of Far-UV CD Spectroscopy
Far-UV CD spectroscopy focuses on the wavelength region between approximately 190 nm and 250 nm. In this range, the CD signal primarily arises from the electronic transitions of the peptide bond chromophore. The amide groups within the polypeptide backbone, when arranged in specific repeating patterns (like helices or sheets), generate characteristic CD spectra due to their chiral environment.
How Far-UV Circular Dichroism Reveals Protein Secondary Structures
Different types of protein secondary structures exhibit distinct and recognizable Far-UV CD spectra:
- α-helices: Characterized by a strong negative band at 222 nm, another negative band at 208 nm, and a strong positive band around 190 nm. The negative bands are often more prominent and widely used for quantification.
- β-sheets: Typically show a negative band around 216-218 nm and a positive band around 195-200 nm. The exact position and intensity can vary depending on the type of β-sheet (e.g., parallel, anti-parallel).
- Random Coils: Generally display a weak negative band around 195 nm and negligible ellipticity above 210 nm, indicating a lack of stable, ordered secondary structure.
- Turns (e.g., β-turns): Can contribute unique features to the Far-UV CD spectrum, although their specific contributions are often harder to deconvolute due to overlap with other secondary structures.
Interpreting Far-UV CD Spectra
Interpreting Far-UV CD spectra involves analyzing the shape, intensity, and position of the bands. The spectra are typically recorded and then often subjected to deconvolution algorithms that compare the experimental spectrum to a database of known protein secondary structures. This allows for the estimation of the percentage of α-helix, β-sheet, turn, and random coil content within a protein.
Typical Far-UV CD Spectroscopy Experimental Process
1. Instrument Setup
- Nitrogen Purge: Purge the spectrophotometer (monochromator and sample chamber) with high-purity nitrogen gas at 5-10 L/min for at least 30 minutes. This eliminates oxygen and ozone, which absorb below 200 nm and interfere with signal quality.
- Lamp Warm-up: Allow the xenon lamp to warm up for 15-30 minutes to ensure stable light output.
- Temperature Control: Set the desired temperature (commonly 20℃) using a Peltier-controlled cell holder, and let the system equilibrate before measurement.
2. Sample and Buffer Preparation
- Baseline Buffer: Prepare buffer identical to the sample buffer but without protein, for baseline correction.
- Protein Sample: Prepare aliquots at the required concentration. For thermal melts, use either multiple aliquots or monitor the same sample over a temperature ramp.
- Degassing and Filtration: Degas samples (e.g., via vacuum or sonication) and filter through 0.22-0.45 µm membranes to eliminate bubbles and particulates.
3. Circular Dichroism Cuvette Selection and Cleaning
- Path Length: Use a quartz cuvette with a short path length (typically 0.1-1 mm) to reduce solvent absorption in the Far-UV range.
- Cleaning: Clean cuvettes thoroughly with 2% Hellmanex, nitric acid, or a designated cleaner, followed by rinsing with deionized water and ethanol.
4. Data Acquisition
- Baseline Scan: Record a spectrum using only the buffer to correct for cuvette and solvent contributions.
- Sample Scan: Load the protein solution into the same cuvette and acquire the CD spectrum.
- Recommended Parameters
| Parameter | Recommended Setting |
|---|---|
| Wavelength Range | 190-250 nm |
| Bandwidth | 1 nm or less |
| Scan Speed | 20-50 nm/min |
| Integration Time | 1-4 seconds |
| Averaged Scans | 3-10 scans to improve signal-to-noise ratio |
| Absorbance Monitoring | Keep absorbance below 1.5–2.0 OD; reduce concentration or path length if exceeded |
5. Data Processing
- Baseline Subtraction: Subtract the buffer spectrum from the sample spectrum.
- Smoothing: Apply minimal smoothing only when necessary to preserve spectral integrity.
- Molar Ellipticity Conversion: Convert raw ellipticity (mdeg) to mean residue ellipticity (MRE) or molar ellipticity (Δε) using accurate concentration and path length values. This standardization allows for data comparison across experiments and publications.
Sample Preparation Guidelines of Far-UV CD Spectroscopy
- Purity: Extremely high protein purity (preferably >95%) is critical. Contaminants, especially other proteins or peptides, will have their own CD signatures and can mask the signal of interest. Aggregates must be removed by centrifugation or filtration.
- Concentration: Typically 0.1 - 0.5 mg/mL for a 1 mm path length cell. The optimal concentration depends on the protein's extinction coefficient and expected CD signal. For shorter path lengths (e.g., 0.1 mm), concentrations may need to be higher (e.g., 1-2 mg/mL). The total absorbance at the lowest wavelength (e.g., 190 nm) should ideally be below 1.5.
- Buffer Composition:
Transparency: Buffers must be highly transparent in the Far-UV region (below 200 nm).
Avoid: High concentrations of many common buffer components (e.g., Tris >20 mM, imidazole, DTT, β-mercaptoethanol, SDS, high concentrations of salts like NaCl >50 mM, acetate, citrate, glycine) absorb strongly in the Far-UV and should be avoided or minimized.
Preferred: Low concentrations of phosphate (e.g., 10-25 mM potassium phosphate), perchlorate, or fluoride salts are generally preferred.
Additives: Denaturants (urea, guanidine HCl), detergents (especially Triton X-100), and amino acid stabilizers (arginine, proline) often have significant Far-UV absorbance and should be used with caution or avoided if possible. If essential, ensure a matched buffer blank.
- Volume: Depends on the cell design, but typically 200-400 µL for standard 1 mm path length cells.
Advantages of Far-UV Circular Dichroism
| Advantages | Description |
|---|---|
| Structural Insight | Provides quantitative data on α-helices, β-sheets, and random coils |
| Sensitive to Changes | Detects subtle conformational changes due to pH, temperature, or ligands |
| Fast & Non-Destructive | Quick measurements; samples often recoverable |
| Native Conditions | Analyzes proteins in solution without crystallization |
| Label-Free | Uses intrinsic peptide bond signals; no labeling required |
| Broad Applicability | Suitable for most proteins and peptides regardless of size |
Disadvantages of Far-UV Circular Dichroism
| Disadvantages | Description |
|---|---|
| Low Resolution | Does not offer atomic-level detail; only secondary structure overview |
| Solvent Limitations | Requires transparent buffers and short path lengths |
| Additive Interference | Many reagents (e.g., detergents, reducing agents) interfere with signal |
| Deconvolution Limits | Accuracy depends on data quality and algorithm performance |
| Structural Ambiguity | May not distinguish between closely related secondary structures |
Applications of Far-UV CD
Far-UV Circular Dichroism is a workhorse in biophysical laboratories due to its wide range of applications:
- Conformational Stability and Denaturation Studies: By monitoring changes in the Far-UV CD spectrum as a function of temperature or denaturant concentration, researchers can determine the melting temperature (Tₘ) and thermodynamic stability of a protein. This is crucial for understanding protein robustness and developing stable formulations.
- Protein Folding and Unfolding Pathways: Real-time Far-UV CD measurements can track the kinetics of protein folding and unfolding, providing insights into the intermediate states adopted during these processes.
- Ligand Binding-Induced Conformational Changes in Secondary Structure: Changes in the Far-UV CD spectrum upon ligand binding can indicate that the binding event induces alterations in the protein's secondary structure.
- Biosimilarity and Biopharmaceutical Characterization: For the development of biosimilar drugs, Far-UV CD is a critical tool to demonstrate the structural similarity of a biosimilar to its reference product, ensuring equivalent efficacy and safety.
Case Study: Detecting Label-Induced Structural Changes Using Far-UV CD
In a study, Far-UV CD spectroscopy was used to examine the structural effects of fluorophore labeling on penetratin, a cell-penetrating peptide. While the native peptide exhibited a typical disordered spectrum with a minimum near 199 nm, rhodamine B (RhB)- and carboxyfluorescein (CF)-labeled conjugates showed new CD features above 220 nm, including a distinct negative band at 233 nm in RhB-PEN. These shifts indicated a conformational change toward more ordered structures, likely α-helical. The induced spectral signals were attributed to chiral exciton coupling between the fluorophores and nearby tryptophan residues. This study highlights Far-UV CD's sensitivity to subtle secondary structure changes caused by chemical modification, making it an essential tool for assessing peptide integrity post-labeling.
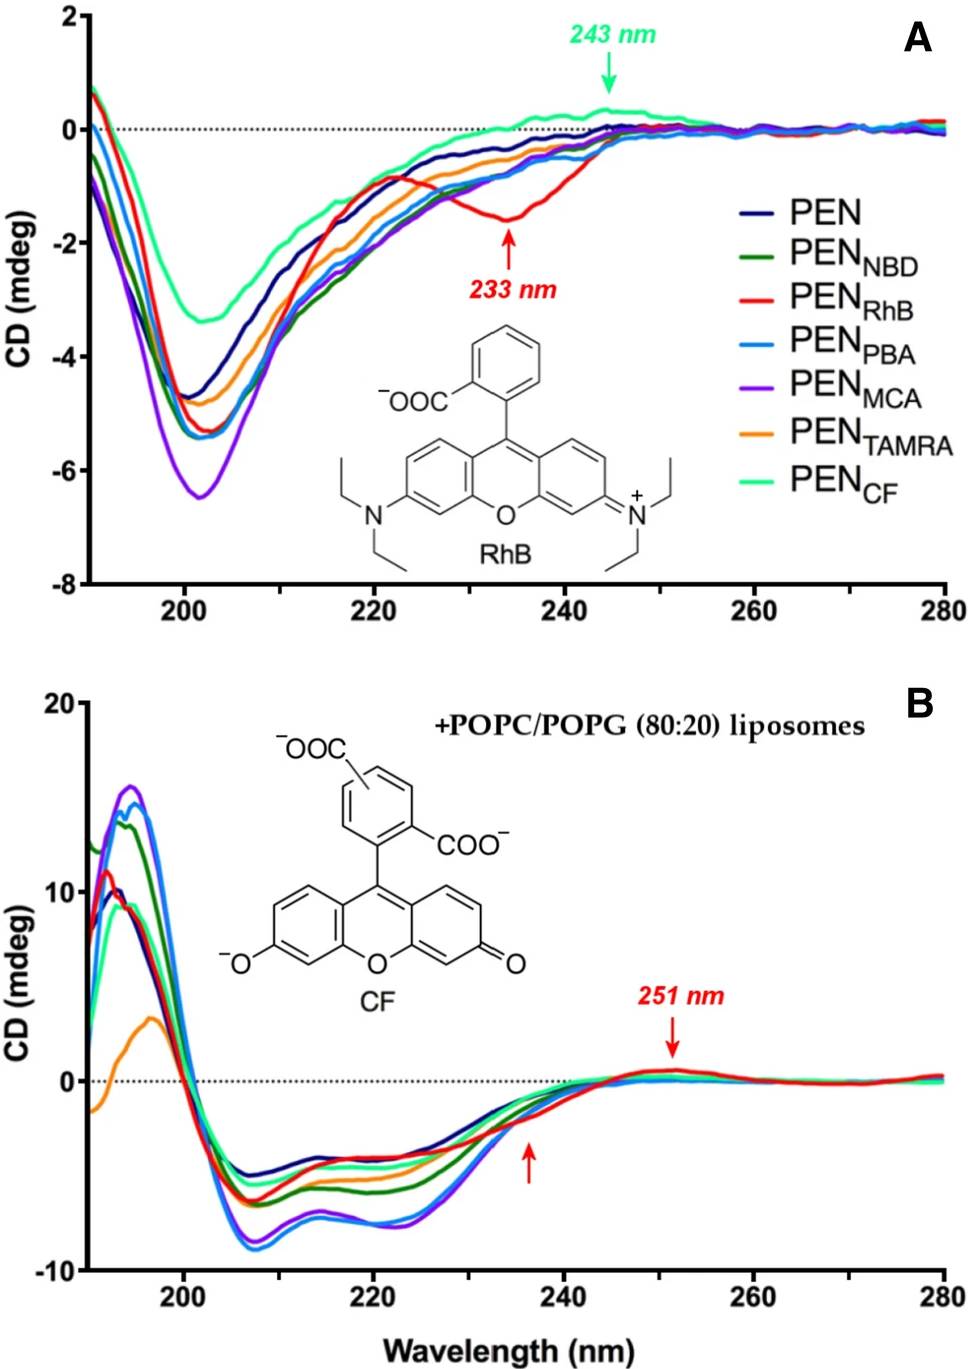 Figure 1. Far-UV circular dichroism spectra of 20 µM penetratin (PEN) and six fluorophore-conjugated derivatives in 10 mM Tris–HCl buffer (pH 7.4), measured (A) without and (B) with 2 mM POPC/POPG (80:20%) liposomes. Arrows indicate induced CD bands for RhB and CF conjugates. Fluorophores include TAMRA, NBD, MCA, and PBA. (Zsila F., et al., 2022)
Near-UV Circular Dichroism: Glimpsing Tertiary Structures
Principles of Near-UV CD Spectroscopy
In contrast to Far-UV CD, Near-UV CD spectroscopy examines the wavelength range between approximately 250 nm and 320 nm. The CD signals in this region originate from the chiral environment of the aromatic amino acid side chains (Tryptophan, Tyrosine, and Phenylalanine) and, to a lesser extent, from disulfide bonds. These chromophores are sensitive to their local environment, meaning their CD signals reflect the specific three-dimensional arrangement, or tertiary structure, of the protein.
How Near-UV Circular Dichroism Reflects Tertiary Structures
Unlike the peptide bond, which has a relatively fixed absorbance, the absorbance properties of aromatic side chains are highly dependent on their position within the folded protein. When a protein folds into its unique tertiary structure, these aromatic residues become fixed in specific orientations, creating a chiral environment that leads to a detectable CD signal. Disulfide bonds, formed between cysteine residues, are also inherently chiral and contribute to the Near-UV CD spectrum.
Role of Aromatic Amino Acids and Disulfide Bonds in Near-UV CD
- Tryptophan (Trp): Possesses the strongest absorbance and CD signal in the Near-UV region, typically showing complex positive and negative bands between 270-300 nm. Its indole ring is highly sensitive to changes in solvent polarity and protein conformation.
- Tyrosine (Tyr): Contributes to the spectrum primarily between 270-280 nm, with a weaker signal than tryptophan. Its phenolic group can be affected by hydrogen bonding and proximity to other residues.
- Phenylalanine (Phe): Has the weakest contribution, with fine structure around 260 nm. Its benzene ring is less sensitive to conformational changes than Trp or Tyr.
- Disulfide Bonds: Exhibit CD signals in the range of 250-290 nm, with their contribution varying depending on their dihedral angles and local environment.
Interpreting Near-UV CD Spectra
Near-UV CD spectra are generally more complex and often less well-defined than Far-UV spectra. They typically consist of several broad, overlapping bands, reflecting the summed contributions of multiple aromatic residues and disulfide bonds in their specific local environments. A well-defined Near-UV CD spectrum indicates a folded, ordered tertiary structure. Conversely, a loss of signal, or a transition to a flat spectrum, often signifies protein unfolding or denaturation, as the aromatic residues lose their fixed chiral environments.
Typical Near-UV CD Spectroscopy Experimental Process
1. Instrument Setup
- Nitrogen Purge: Optional but recommended to reduce noise, especially near 250 nm.
- Lamp Warm-up: Allow the xenon lamp to stabilize (15-30 minutes).
- Temperature Control: Maintain a stable sample temperature throughout the experiment.
2. Sample and Buffer Preparation
- Baseline Buffer: Use a protein-free buffer identical to the sample buffer for baseline correction.
- Protein Sample: Near-UV CD requires higher protein concentrations than Far-UV; exact values depend on the signal strength of aromatic residues.
- Degassing and Filtration: Degas to eliminate bubbles, and filter (e.g., 0.22-0.45 µm) or centrifuge to remove aggregates that may scatter light.
3. Cuvette Selection and Cleaning
- Path Length: Use a longer path length (typically 10 mm) due to weaker signals from aromatic chromophores. Shorter cuvettes (5 mm) may be used for concentrated samples.
- Cleaning: Clean quartz cells thoroughly to avoid contamination that could affect signal accuracy.
4. Data Acquisition
- Baseline Scan: Measure the baseline using the blank buffer.
- Sample Scan: Measure the protein sample under the same conditions.
- Recommended Parameters
| Parameter | Typical Setting |
|---|---|
| Wavelength Range | 250-320 nm (extendable to 350 nm if needed) |
| Bandwidth | 1-2 nm |
| Scan Speed | 10-20 nm/min |
| Integration Time | 4-8 seconds |
| Scans Averaged | 10-20 or more to improve signal quality |
| Absorbance Monitoring | Ensure samples do not exceed detector limits |
5. Data Processing
- Baseline Subtraction: Subtract the buffer spectrum from the sample data.
- Smoothing: Apply smoothing cautiously to improve signal clarity without losing spectral features.
- Molar Ellipticity Conversion: Convert to MRE or Δε for normalized comparison between samples.
Sample Preparation Guidelines of Near-UV CD Spectroscopy
- Purity: High purity (>90%) is still essential, as contaminants can have their own Near-UV absorbance or CD signals. Aggregates are a major concern and must be removed.
- Concentration: Higher protein concentrations are generally required for Near-UV CD, typically 0.5 - 2 mg/mL (or even higher, up to 10 mg/mL for certain proteins) when using a 1 cm path length cell. The specific concentration depends on the number and type of aromatic residues and disulfide bonds.
- Buffer Composition:
Transparency: Buffers generally have less interference in the Near-UV range compared to Far-UV. However, certain additives with strong absorbance in this region (e.g., some dyes, specific small molecules, high concentrations of certain salts or denaturants if not ultrapure) should be avoided or carefully matched in the blank.
Common Buffers: Most common physiological buffers like phosphate, Tris, HEPES, and low concentrations of salts are acceptable.
Additives: Denaturants (urea, guanidine HCl) can be used, but high concentrations may have slight absorbance or alter the solvent's refractive index. Ensure purity of denaturants.
- Volume: Dependent on the cell. For a 1 cm path length cell, typically 2-3 mL is needed for standard cells, though micro-volume cells can reduce this to ~500 µL or less.
Advantages of Near-UV Circular Dichroism
| Advantages | Description |
|---|---|
| Tertiary Structure Insight | Detects folding and conformational integrity, including protein interactions |
| Sensitive to Local Changes | Responds to structural shifts near aromatic residues and disulfide bonds |
| Minimal Backbone Interference | Signals are distinct from peptide bonds, highlighting higher-order structure |
| Buffer Flexibility | Compatible with many physiological buffers and salt conditions |
| Real-Time Monitoring | Suitable for tracking folding or ligand-binding events over time |
Disadvantages of Near-UV Circular Dichroism
| Disadvantages | Description |
|---|---|
| Low Signal Intensity | Requires higher protein concentrations and longer scan times |
| Complex Spectra | Broad, overlapping signals limit quantitative interpretation |
| Dependent on Aromatic Content | Weak or no signal from proteins lacking aromatic residues or disulfide bonds |
| Limited Atomic Detail | Cannot resolve residue-level changes without complementary methods |
| Aggregation Artifacts | Sensitive to light scattering from aggregates, which can distort spectra |
Applications of Near-UV CD
Near-UV Circular Dichroism is invaluable for characterizing the higher-order structure of proteins:
- Monitoring Ligand Binding and Conformational Shifts in the Tertiary Structure: Changes in the Near-UV CD spectrum upon ligand binding can indicate that the binding event induces subtle or significant alterations in the protein's tertiary structure, especially in the vicinity of aromatic residues or active sites.
- Assessing Protein Aggregation and Misfolding: The formation of protein aggregates often leads to a significant loss or alteration of the Near-UV CD signal as the native tertiary structure is disrupted. This makes it a useful tool for stability studies and formulation development.
- Probing Active Site Changes: If aromatic residues are located within or near a protein's active site, changes in their environment upon substrate binding or inhibitor interaction can be detected by Near-UV CD.
- Investigating Protein-Protein Interactions and Quaternary Structure Assembly: The formation of protein complexes (quaternary structure) can induce changes in the tertiary structure of individual subunits, leading to measurable alterations in the Near-UV CD spectrum.
Case Study: Evaluating HAS-Ligand Interactions with Near-UV CD
A recent study used near-UV CD spectroscopy to evaluate how various ligands affect the tertiary structure of human serum albumin (HSA). Binding of phenylbutazone and ketoprofen caused significant spectral changes, particularly around 289 nm, indicating alterations near aromatic residues like Trp-214 and Tyr-411. Even low-affinity ligands such as prednisolone and indapamide induced subtle but detectable shifts in the near-UV CD spectrum. These results show that near-UV CD is a sensitive tool for detecting conformational changes in HSA, providing valuable insights into ligand binding even at weak or non-specific sites.
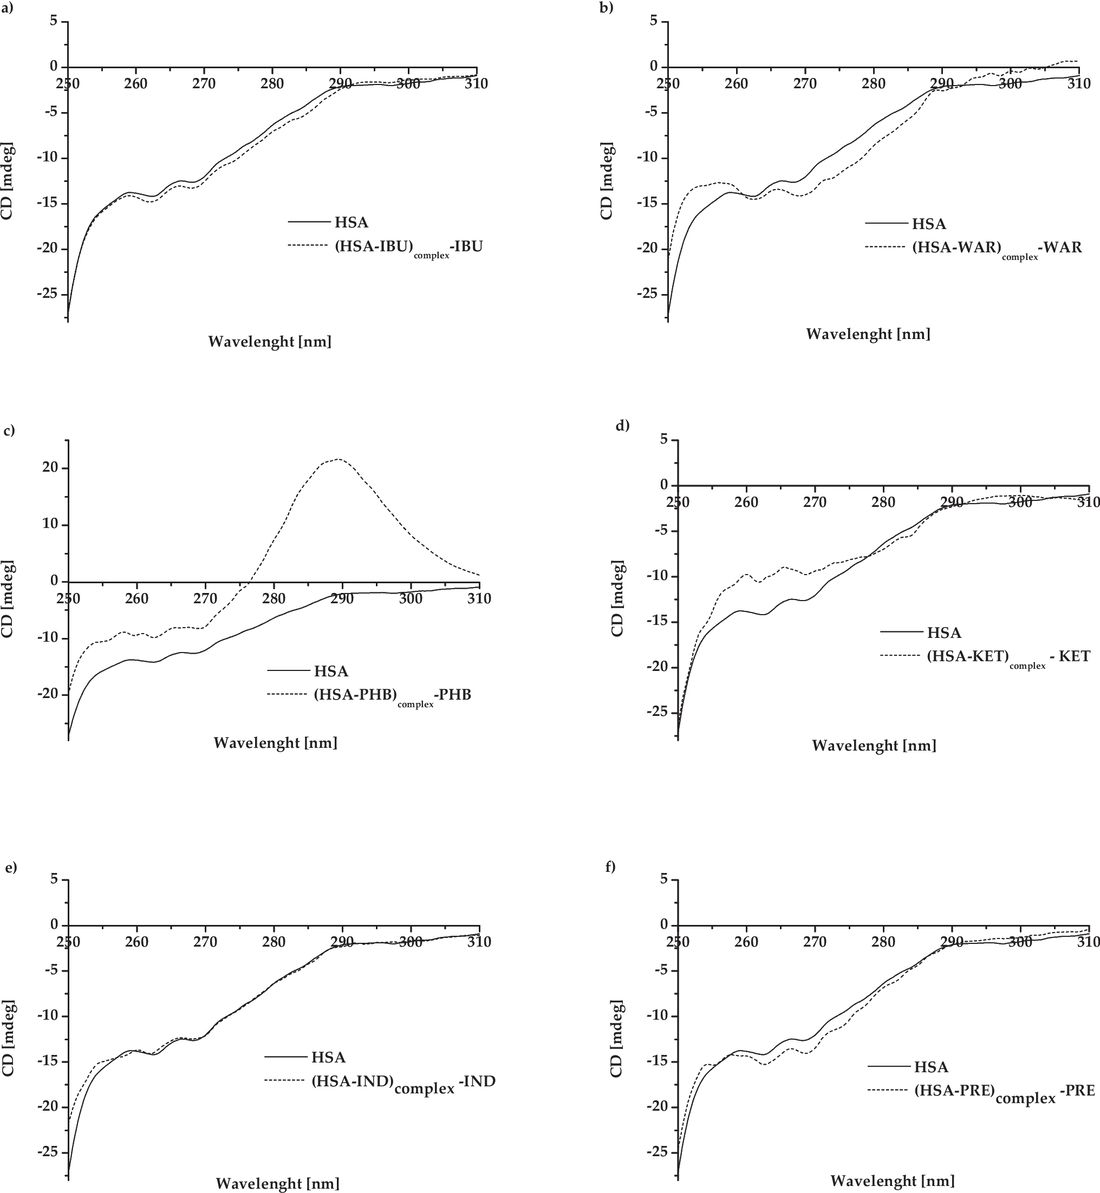 Figure 2. Near-UV circular dichroism spectra of HSA and its complexes with various ligands at a 1:5 molar ratio. Spectra were baseline-corrected by subtracting the free ligand signal. Ligands include: (a) PHB, (b) WAR, (c) IBU, (d) KET, (e) IND, and (f) PRE. (Rogóż W, et al., 2024)
What Is the Difference Between Far UV and Near UV Circular Dichroism?
| Feature | Far-UV Circular Dichroism | Near-UV Circular Dichroism |
|---|---|---|
| Wavelength Range | ~190-250 nm | ~250-320 nm |
| Chromophore | Peptide backbone (amide bonds) | Aromatic amino acids (Trp, Tyr, Phe) & disulfide bonds |
| Information Provided | Secondary structure (α-helix, β-sheet, random coil) | Tertiary structure (overall fold, aromatic environment), Quaternary structure changes |
| Signal Strength | Strong, well-defined | Weaker, complex, broad, overlapping bands |
| Sensitivity to Changes | High sensitivity to backbone conformation changes | High sensitivity to subtle local changes around aromatics/disulfides |
| Interpretation | Often quantifiable (percentage of secondary structures) | Qualitative; indicates folding, unfolding, or subtle shifts |
| Common Use Cases | Protein folding/unfolding, stability, biosimilarity | Ligand binding, aggregation, active site changes, protein-protein interactions |
| Spectra Appearance | Distinct, characteristic peaks/troughs | Broad, often noisy signals; complex, unique to each protein |
| Sample Concentration | 0.1 - 0.5 mg/mL (1 mm path) | 0.5 - 2 mg/mL (1 cm path; often higher needed) |
| Preferred Buffers | Low conc. Phosphate (10-25 mM), perchlorate, fluoride. Must be highly UV transparent. | Phosphate, Tris, HEPES, physiological salt concs. (most common buffers compatible). |
| Buffers to Avoid/Minimize | High conc. Tris (>20 mM), imidazole, DTT, BME, SDS, high salt (>50 mM NaCl), acetate, citrate, glycine. | Some dyes, highly absorbing small molecules, impure denaturants. |
| Advantages | Direct, quantifiable secondary structure; high sensitivity to global folding; fast; non-destructive; solution-based. | Direct tertiary structure; highly sensitive to localized changes; broader buffer compatibility. |
| Disadvantages | Limited atomic resolution; strong solvent absorbance (restricts buffer); interference from additives; deconvolution challenges. | Weaker signal (requires higher conc/longer scans); complex, qualitative interpretation; depends on aromatic residues/disulfides; sensitive to aggregation. |
While distinct, Far-UV and Near-UV CD are highly complementary. Neither technique alone provides a complete picture of protein structure.
- A protein can maintain its overall secondary structure (Far-UV CD) even if its tertiary structure is disrupted (Near-UV CD changes). For example, a molten globule would show native-like Far-UV but weak Near-UV.
- Conversely, subtle tertiary structure changes (Near-UV CD, e.g., ligand binding) may not significantly alter overall secondary structure (Far-UV CD).
Therefore, combining both Far-UV and Near-UV CD measurements provides a much more robust and holistic understanding of protein conformation, stability, and dynamics. It allows researchers to pinpoint exactly which level of structural organization is affected by a given perturbation.
At Creative Biostructure, we offer expert Far-UV and Near-UV CD spectroscopy services tailored to support protein characterization across research and biopharmaceutical applications. Whether you're assessing biosimilarity, studying protein-ligand binding, or optimizing formulations, our customized solutions and commitment to quality ensure accurate results and responsive support. Contact us today to discuss your project or request a quote.
References
- Greenfield N J. Using circular dichroism spectra to estimate protein secondary structure. Nature Protocols. 2006, 1(6): 2876-2890.
- Li C H, Nguyen X, Narhi L, et al. Applications of circular dichroism (CD) for structural analysis of proteins: qualification of near‐and far‐UV CD for protein higher order structural analysis. Journal of Pharmaceutical Sciences. 2011, 100(11): 4642-4654.
- Wei Y, Thyparambil A A, Latour R A. Protein helical structure determination using CD spectroscopy for solutions with strong background absorbance from 190 to 230 nm. Biochimica et Biophysica Acta (BBA)-Proteins and Proteomics. 2014, 1844(12): 2331-2337.
- Zsila F. Far-UV circular dichroism signatures indicate fluorophore labeling induced conformational changes of penetratin. Amino Acids. 2022, 54(7): 1109-1113.
- Linhares L A, Ramos C H I. Unlocking insights into folding, structure, and function of proteins through circular dichroism spectroscopy—a short review. Applied Biosciences. 2023, 2(4): 639-655.
- Rogóż W, Owczarzy A, Kulig K, et al. Ligand-human serum albumin analysis: the near-UV CD and UV-Vis spectroscopic studies. Naunyn-Schmiedeberg's Archives of Pharmacology. 2024: 1-13.