Circular Dichroism (CD) Spectroscopy is a spectroscopic technique that measures the differential absorption of left and right circularly polarized light by chiral molecules. Since proteins are inherently chiral dueasing to their amino acid composition and folded structures, CD is an exceptionally sensitive tool for studying their conformational properties. It allows researchers to quickly assess protein secondary structure, tertiary structure, and even observe dynamic processes like protein folding and conformational changes.
In this article, we'll dive deep into how CD spectroscopy works, what kind of information it provides about proteins, and its broad applications in biochemical and biophysical research. By the end, you'll have a comprehensive understanding of why CD is an indispensable technique in the protein scientist's toolkit.
How CD Works for Proteins
At its heart, Circular Dichroism is about light and molecular asymmetry. When plane-polarized light passes through a chiral sample (like a protein), it becomes elliptically polarized. CD spectroscopy measures the difference in absorption between left and right circularly polarized light, which only occurs when molecules are chiral. This differential absorption is reported in units of ellipticity (mdeg) or molar ellipticity.
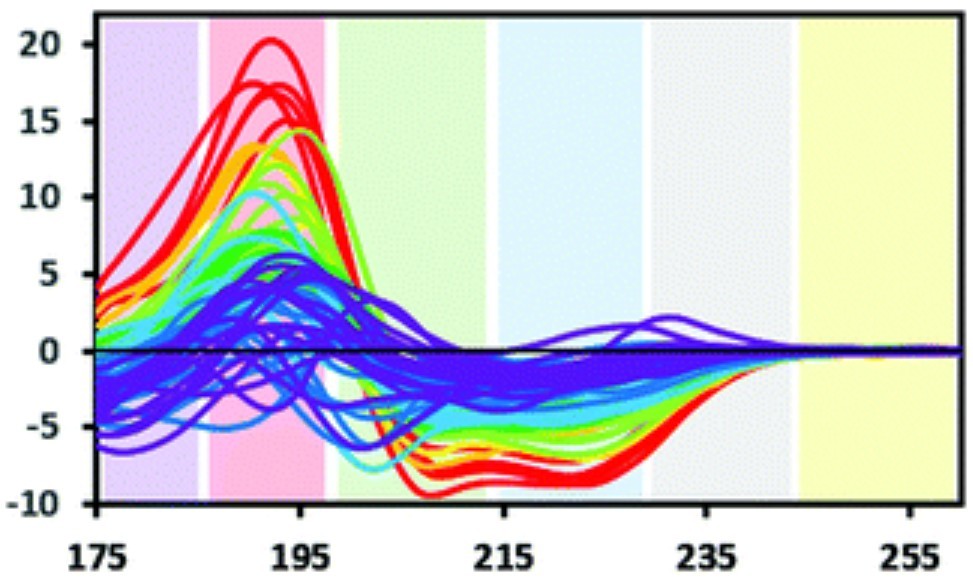 Figure 1. Characteristic Wavelength Ranges for Electronic Transitions Detected by Circular Dichroism. Colored bands represent approximate wavelength ranges associated with various electronic transitions contributing to CD signals. Yellow: aromatic residue signals observable with extended pathlength. Grey: occasional signal from stacked aromatic amino acids. Blue: n→π* transition. Green and red: π→π* transitions, often showing exciton splitting. Purple: charge transfer transition, typically visible only with synchrotron radiation source (SRCD). (Miles A J, et al., 2021)
If you're new to CD spectroscopy, you can find more information in our in-depth resource: A Beginner's Guide to Circular Dichroism Spectroscopy.
What are the Chromophores Detected by CD Spectroscopy of a Protein?
For proteins, the CD signal arises primarily from three types of chromophores:
- The Peptide Bond: This is the most crucial chromophore for protein secondary structure analysis in the far-UV region (typically 190-250 nm). The amide backbone of the polypeptide chain, with its repeating peptide bonds, adopts characteristic orientations in different secondary structures (e.g., alpha-helices, beta-sheets). These orientations lead to unique CD spectral patterns.
- Aromatic Amino Acids: Tryptophan, Tyrosine, and Phenylalanine contain aromatic rings that absorb light in the near-UV region (typically 250-320 nm). The CD signals from these residues are highly sensitive to their local environment and overall protein tertiary structure. Changes in these signals indicate alterations in the three-dimensional folding of the protein.
- Disulfide Bonds: These covalent linkages between cysteine residues also contribute to the CD spectrum, particularly in both the far- and near-UV regions, further reflecting aspects of protein conformation.
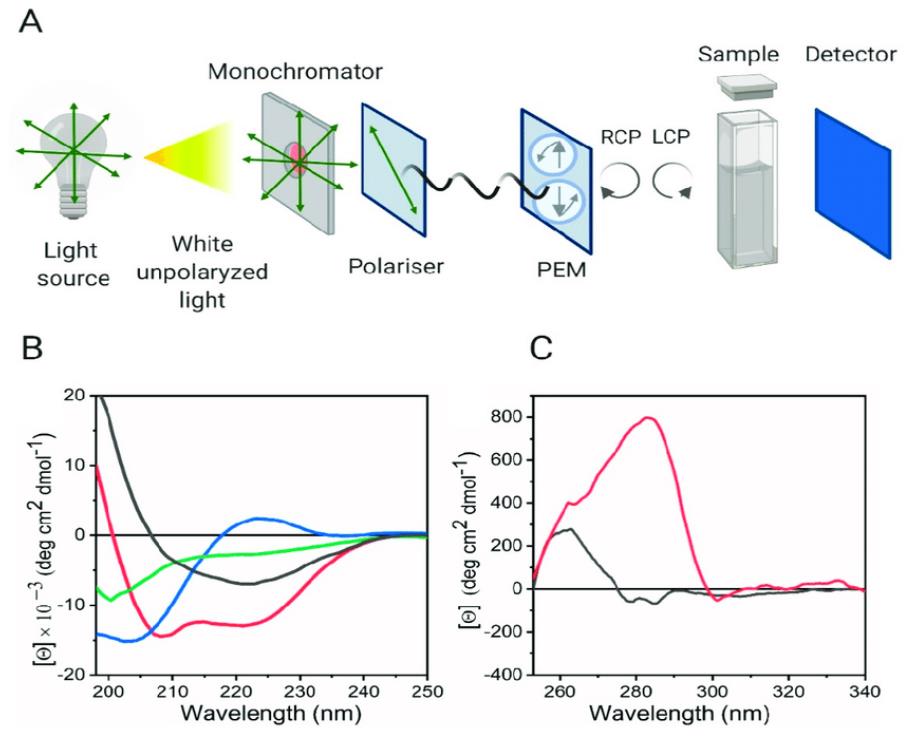
The instrument used for CD measurements, a CD spectropolarimeter, consists of a light source, a monochromator to select specific wavelengths, a modulator to generate left and right circularly polarized light, a sample compartment, and a detector to measure light absorption.
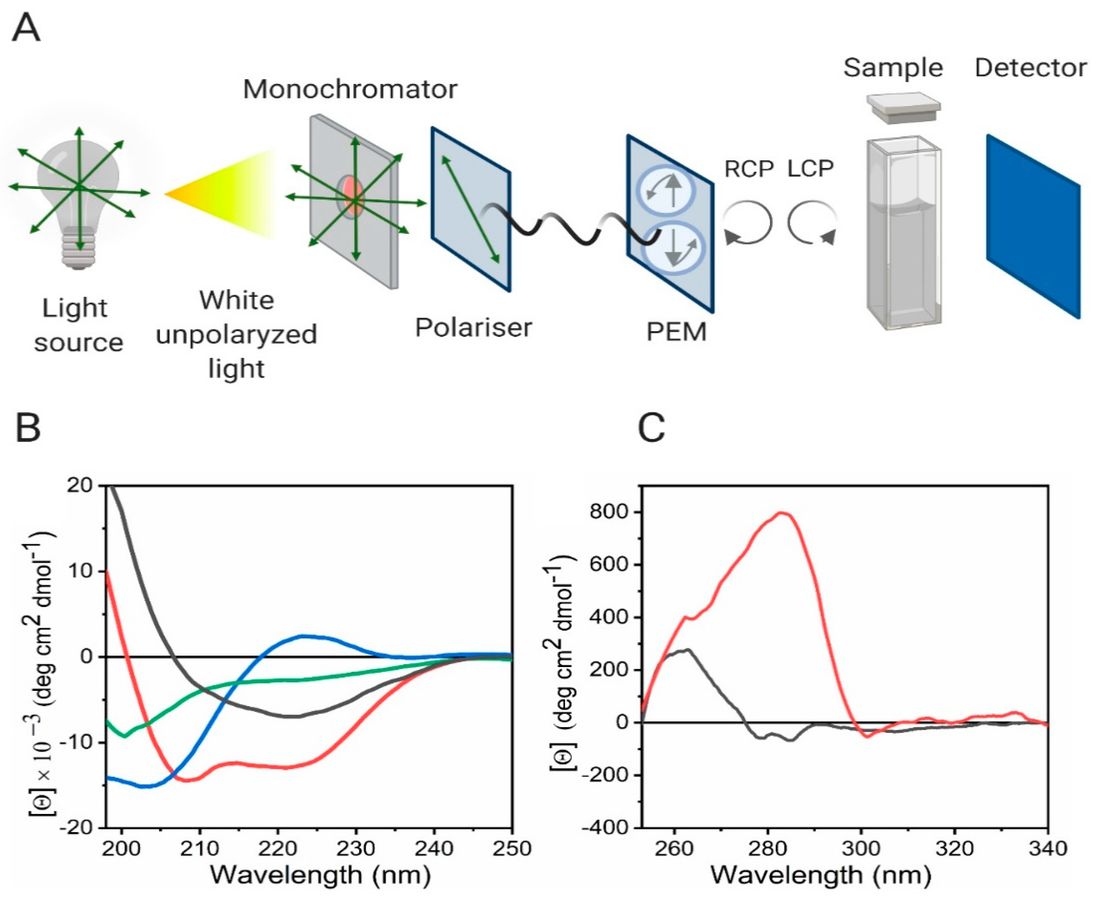 Figure 2. Circular Dichroism for Analyzing Protein Secondary and Tertiary Structures. (A) Schematic diagram of a CD spectrometer setup. (B) Far-UV CD spectra showing typical patterns for protein secondary structures: random coil (green), α-helix (red), β-sheet (black), and polyproline II (blue). (C) Near-UV CD spectra of two proteins, one containing tryptophan and tyrosine residues (red), and the other containing only tyrosine (black), illustrating tertiary structure features. (Pignataro M F, et al., 2020)
Deciphering Protein Secondary Structure with Far-UV CD Spectroscopy
One of the most common and powerful applications of CD spectroscopy for proteins is the determination of protein secondary structure. In the far-UV region, the CD spectrum is dominated by the electronic transitions of the peptide bond. Different arrangements of these bonds, corresponding to distinct secondary structural elements, produce unique and recognizable CD signatures.
Key Secondary Structures and Their CD Signatures
- Alpha-helix circular dichroism: An alpha-helix typically exhibits a characteristic double minimum at approximately 208 nm and 222 nm, along with a strong positive peak around 190 nm. The intensity of these signals directly correlates with the helicity of the protein.
- Beta-sheet circular dichroism: Beta-sheets (both parallel and anti-parallel) generally show a single negative minimum around 216-218 nm and a positive maximum around 195-198 nm.
- Beta-turn circular dichroism: Beta-turns have more diverse spectral patterns, but often present a negative minimum near 205 nm and a positive maximum near 220 nm.
- Random coil circular dichroism: A random coil conformation, representing a disordered or unfolded state, typically displays a strong negative peak around 195 nm and very low ellipticity at longer wavelengths.
- Coiled coil circular dichroism: While similar to alpha-helices, coiled coils can show subtle differences due to their superhelical arrangement.
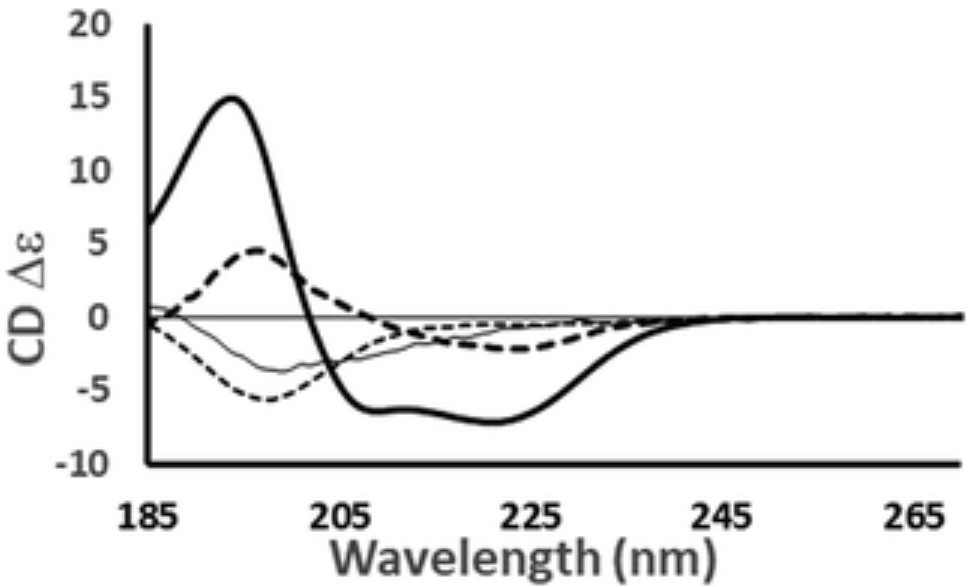 Figure 3. Representative CD spectra of proteins with different dominant secondary structures: haemoglobin (predominantly α-helix), concanavalin A (predominantly anti-parallel β-sheet), elastase (predominantly right-handed twisted β-sheet), and HASPA (predominantly disordered). The spectra illustrate how overall shape and intensity reflect the combined contributions of structural elements. Spectral data are available in the PCDDB with accession codes CD0000037000, CD0000020000, CD0000031000, and CD0005282000, respectively. A strong negative band near 222 nm suggests high α-helical content, while a negative band near 200 nm indicates disorder. (Miles A J, et al., 2021)
Quantitative Estimation of Protein Secondary Structure
Beyond qualitative identification, using circular dichroism spectra to estimate protein secondary structure allows for quantitative analysis. Various algorithms and software packages (e.g., K2D, CDPro, CONTIN) can deconvolute the experimental CD spectrum into the percentage contributions of different secondary structures (alpha-helix, beta-sheet, turns, random coil). This provides a valuable, quick estimate of the overall structural composition of a protein.
Practical Considerations
For accurate far-UV CD measurements, protein concentration for circular dichroism is critical, typically in the range of 0.1-1.0 mg/mL. The choice of buffer is also important, as some buffer components (e.g., high salt concentrations, certain organic solvents) can absorb in the far-UV and interfere with the signal. Our experts at Creative Biostructure guide you through optimal sample preparation to ensure high-quality data.
Exploring Protein Tertiary Structure and Conformation with Near-UV CD Spectroscopy
While the far-UV region informs us about local, repeating structures, the near-UV CD spectroscopy region (250-320 nm) provides insights into the overall protein tertiary structure and the specific environment of the aromatic amino acids (tryptophan, tyrosine, phenylalanine) and disulfide bonds.
The signals in this region are much weaker than in the far-UV because they arise from individual side chains rather than the entire peptide backbone. However, their sensitivity to the chiral environment of these chromophores makes near-UV CD a powerful tool for:
- Monitoring subtle conformational changes: Even small rearrangements in the protein's three-dimensional fold can alter the environment of aromatic residues, leading to changes in the near-UV CD spectrum.
- Distinguishing folded vs. unfolded states: A well-ordered protein will exhibit a distinct near-UV CD spectrum, whereas an unfolded protein (like a random coil) will typically show very little or no signal, making circular dichroism of folded and unfolded protein an easy distinction.
- Assessing structural integrity: Any disruption to the specific arrangement of aromatic side chains, often indicative of denaturation or misfolding, will be reflected in the near-UV CD spectrum.
To better understand the differences between spectral regions, see Far-UV vs Near-UV Circular Dichroism: A Complete Guide to Protein Characterization for a detailed comparison.
Unraveling Protein Dynamics: Folding, Stability, and Interactions
Circular Dichroism isn't just about static structures; it's also incredibly useful for probing the dynamic world of proteins, including their folding pathways, stability under different conditions, and interactions with other molecules.
Protein Folding by Circular Dichroism
Protein folding is a complex process where a linear polypeptide chain acquires its unique three-dimensional structure. CD spectroscopy protein folding allows researchers to track these events in real-time. By rapidly mixing an unfolded protein with refolding conditions and continuously monitoring the CD signal, one can observe the kinetics of secondary structure formation. This makes the use of circular dichroism spectroscopy to study protein folding, form and function a cornerstone of biophysical investigations.
Thermal Denaturation and Stability
A common application is to study protein stability using thermal denaturation experiments. By monitoring the circular dichroism signal as a function of temperature (circular dichroism temperature dependence), you can determine the melting temperature (Tm) of a protein, which is a measure of its thermal stability. As the protein unfolds due to increasing temperature, its CD spectrum changes from a folded state signature to that of a random coil. Plotting these changes as a function of temperature yields a thermal unfolding curve, from which the Tm can be precisely determined. This is known as circular dichroism thermal denaturation or simply circular dichroism denaturation.
Conformational Changes and Ligand Binding
Circular dichroism conformational change is a key area of study. When a protein binds to a ligand, undergoes post-translational modification, or interacts with another protein, it often experiences subtle or dramatic conformational adjustments. CD spectroscopy can detect these changes in both secondary and tertiary structure. This makes it a valuable tool for circular dichroism analysis for protein-protein interactions, providing insights into binding events and their structural consequences.
Studying Intrinsically Disordered Proteins (IDPs)
Traditionally, protein research focused on well-folded, stable structures. However, many proteins, known as Intrinsically Disordered Proteins (IDPs), lack a stable, ordered three-dimensional structure under physiological conditions. Circular dichroism of intrinsically disordered proteins is particularly useful here. Their characteristic random coil circular dichroism signature in the far-UV region helps confirm their disordered nature. CD can also monitor their induced folding upon binding to a partner or changes in environmental conditions.
Membrane Proteins
Studying membrane proteins presents unique challenges due to their hydrophobic nature and requirement for detergents or lipid environments. However, circular dichroism membrane proteins research is still feasible. While sample preparation is more complex, CD can provide critical information on their secondary structure content and conformational stability within these challenging environments.
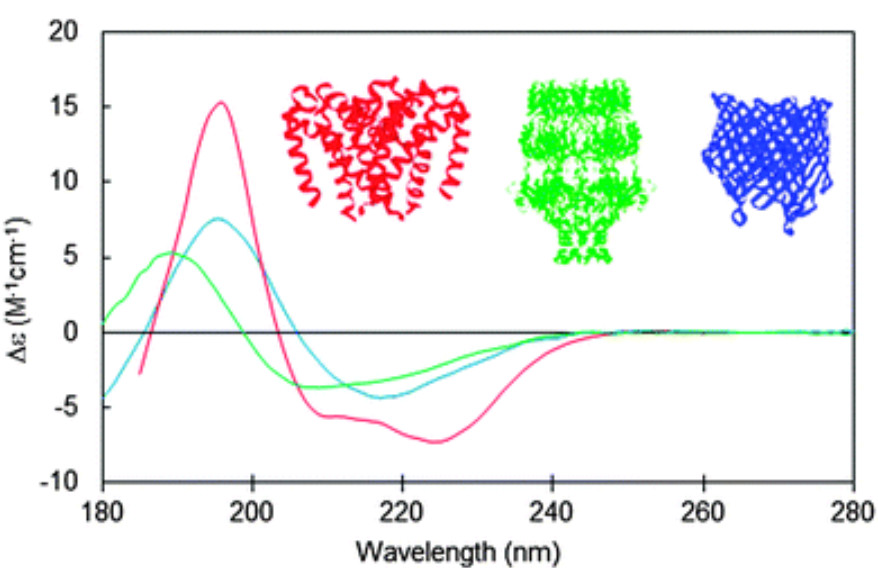 Figure 4. CD spectra of membrane proteins with varying secondary structures: red, predominantly antiparallel α-helical bundle (sodium channel pore, PCDDB ID CD0004012000; PDB 4F4L); blue, predominantly β-barrel (BTUB outer membrane cobalamin transporter, CD0000102000; PDB 1NQE); green, mixed helices, β-sheets, and unordered structure (WZA translocon, CD0000128000; PDB 2J58). Insets show corresponding crystal structures in matching colors. (Miles A J, et al., 2016)
Advanced Applications and Considerations in CD Spectroscopy
The versatility of CD extends to a variety of specialized applications:
- Kinetics Studies: Beyond protein folding, circular dichroism kinetics can be used to monitor any process that involves a conformational change, such as enzymatic reactions or ligand dissociation.
- Peptide Studies: Given their smaller size and often simpler structures, circular dichroism peptides analysis is a routine application. It's often used to study helix induction, aggregation, or interactions with membranes.
- Antibody Analysis: Circular dichroism antibody studies are valuable for assessing the structural integrity and conformational stability of therapeutic antibodies, crucial for quality control and formulation development. See CD Spectroscopy in Biopharma: Principles & Applications for more.
- Protein Aggregation: Aggregation circular dichroism can detect changes in secondary structure associated with protein aggregation, often characterized by an increase in beta-sheet content.
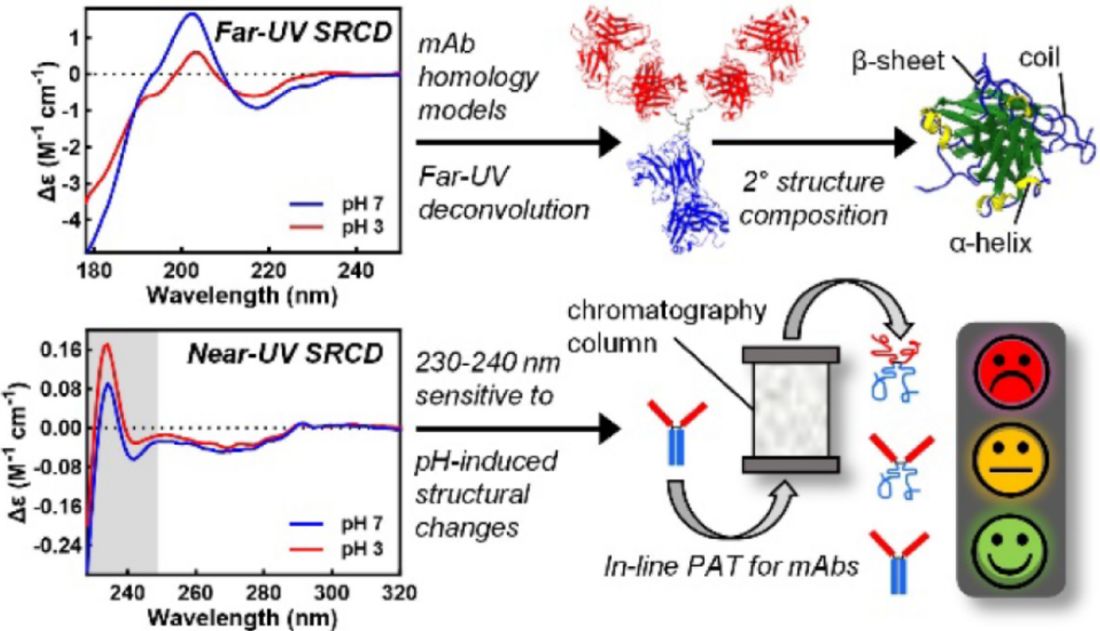 Figure 5. High-quality CD spectra of 14 therapeutic monoclonal antibodies (mAbs) were collected in both native and acid-stressed conditions using synchrotron radiation. The study identified consistent secondary structure assignment using SP175 and SMP180 reference sets and revealed two pH-sensitive spectral features: a far-UV peak at 201-202 nm and a near-UV exciton couplet at 230-240 nm, supporting future in-line structural monitoring applications. (Bruque M G, et al., 2024)
Advantages and Limitations of Circular Dichroism
Like any technique, CD spectroscopy has its strengths and weaknesses.
| Advantages | Limitations |
|---|---|
|
|
Conclusion: CD Spectroscopy as an Essential Tool in Protein Science
CD spectroscopy remains a vital technique for studying proteins. It provides rapid and non-destructive insights into secondary and tertiary structures, as well as dynamic processes such as folding and denaturation. This makes CD spectroscopy valuable across diverse applications, including fundamental research, drug discovery, and biopharmaceutical development.
As protein science progresses, the broad applicability of CD spectroscopy ensures its continued importance. It serves as a reliable method for initial characterization and ongoing monitoring of protein integrity, complementing high-resolution structural techniques.
At Creative Biostructure, we are dedicated to offering advanced solutions for protein analysis. Whether you need to evaluate the secondary structure of a novel protein, assess its stability, monitor conformational changes upon ligand binding, or investigate the folding of intrinsically disordered proteins, we are here to support your research. Explore our circular dichroism spectroscopy service to discover how we can help you gain deeper insights into protein structure and behavior. Contact us today to discuss your project!
References
- Greenfield N J. Analysis of the kinetics of folding of proteins and peptides using circular dichroism. Nature Protocols. 2006, 1(6): 2891-2899.
- Micsonai A, Wien F, Kernya L, et al. Accurate secondary structure prediction and fold recognition for circular dichroism spectroscopy. Proceedings of the National Academy of Sciences. 2015, 112(24): E3095-E3103.
- Miles A J, Wallace B A. Circular dichroism spectroscopy of membrane proteins. Chemical Society Reviews. 2016, 45(18): 4859-4872.
- Pignataro M F, Herrera M G, Dodero V I. Evaluation of peptide/protein self-assembly and aggregation by spectroscopic methods. Molecules. 2020, 25(20): 4854.
- Rodger A, Marshall D. Beginners guide to circular dichroism. Biochemist. 2021, 43(2): 58-64.
- Miles A J, Janes R W, Wallace B A. Tools and methods for circular dichroism spectroscopy of proteins: a tutorial review. Chemical Society Reviews. 2021, 50(15): 8400-8413.
- Segatta F, Rogers D M, Dyer N T, et al. Near-ultraviolet circular dichroism and two-dimensional spectroscopy of polypeptides. Molecules. 2021, 26(2): 396.
- Linhares L A, Ramos C H I. Unlocking insights into folding, structure, and function of proteins through circular dichroism spectroscopy—a short review. Applied Biosciences. 2023, 2(4): 639-655.
- Bruque M G, Rodger A, Hoffmann S V, et al. Analysis of the Structure of 14 Therapeutic Antibodies Using Circular Dichroism Spectroscopy. Analytical Chemistry. 2024, 96(38): 15151-15159.