What is Circular Dichroism (CD)?
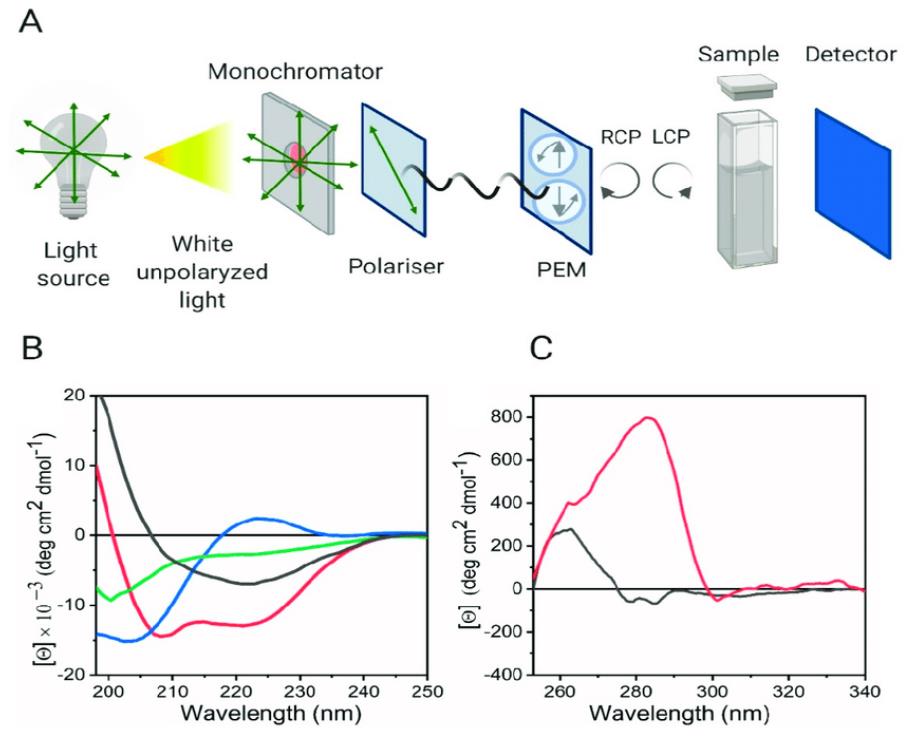
Circular Dichroism is a spectroscopic technique that exploits the inherent chirality (handedness) of biological molecules. It measures the differential absorption of left and right circularly polarized light by these chiral entities. Many biomolecules, including proteins with their L-amino acid constituents and nucleic acids with their helical structures, possess this chirality, making them amenable to CD analysis. When circularly polarized light interacts with a chiral molecule, one direction of polarization is absorbed slightly more than the other. This difference in absorbance, measured as ellipticity or molar dichroic absorption, generates a CD spectrum that acts as a unique fingerprint of the molecule's conformational state.
For those new to CD spectroscopy, our detailed introduction A Beginner's Guide to Circular Dichroism Spectroscopy is a great place to start.
What Makes CD Spectroscopy Essential for Biopharma Development?
The significance of circular dichroism in biopharma stems from its ability to provide crucial insights into the structural integrity and conformational dynamics of therapeutic biomolecules. From early-stage drug discovery to final product quality control, CD spectroscopy plays a vital role in ensuring the development of safe and effective biopharmaceuticals. It allows researchers to probe the protein secondary structure analysis, assess higher-order structure (HOS) comparability between different batches or biosimilars, and monitor the impact of various environmental factors on molecular conformation. Consequently, understanding the application of CD in biopharma is fundamental for anyone involved in the lifecycle of a biologic drug.
Principles of CD Spectroscopy
How CD Spectroscopy Works
CD spectroscopy hinges on the interaction of circularly polarized light with chiral molecules. Linearly polarized light can be considered as a superposition of equal intensity left and right circularly polarized light waves. As this light passes through a sample containing chiral molecules, the differential absorption of the left and right components leads to the emergent light becoming elliptically polarized. The instrument measures this ellipticity (θ) as a function of wavelength. This measured ellipticity is then often converted to molar ellipticity ([θ]) or molar dichroic absorption (Δε) for quantitative analysis and comparison.
Understanding CD Spectra: Far-UV vs. Near-UV
The CD spectrum of a protein typically exhibits distinct regions that provide information about different aspects of its structure:
- Far-UV CD Spectra (approximately 190-250 nm): This region is particularly sensitive to the peptide bond and provides valuable information about the protein secondary structure analysis. The characteristic shapes and intensities of the far-UV CD bands can be correlated with the proportions of different secondary structural elements, such as alpha-helices (exhibiting negative bands around 222 nm and 208 nm, and a positive band around 193 nm), beta-sheets (showing a negative band around 218 nm and a positive band around 195 nm), random coils, and turns. This makes far-UV CD an essential tool for assessing whether a protein maintains its intended fold and for comparing the overall secondary structure content between different formulations or batches, crucial for biosimilar structural analysis and HOS comparability.
- Near-UV CD Spectra (approximately 250-320 nm): This region probes the local environment of aromatic amino acid residues (phenylalanine, tyrosine, and tryptophan) and disulfide bonds. The signals in the near-UV CD spectrum arise from electronic transitions within these chromophores, which are sensitive to their specific spatial arrangement and interactions within the folded protein's tertiary structure. Therefore, near-UV CD spectroscopy provides insights into the protein's overall fold and the symmetry of its environment, complementing the information obtained from far-UV CD and offering a more holistic view of the higher-order structure. Changes in the near-UV CD spectrum can indicate alterations in the tertiary packing, which are often critical for protein function and stability.
For a comprehensive comparison of the spectral regions, refer to Far-UV vs Near-UV Circular Dichroism: A Complete Guide to Protein Characterization.
Key Applications of CD Spectroscopy in Biopharma
The versatility and sensitivity of CD spectroscopy have led to its widespread adoption across various stages of biopharmaceutical development and quality control.
Structural Characterization of Biologics
- Protein Secondary Structure Analysis: As mentioned earlier, far-UV CD is a cornerstone technique for determining the relative amounts of different secondary structural elements in a protein. This information is vital for confirming that a recombinant protein has folded correctly and for assessing the impact of mutations, modifications, or formulation changes on the protein's overall fold.
- Higher-Order Structure (HOS) Comparability: The structural integrity of biologics is paramount for their safety and efficacy. HOS comparability studies, which aim to demonstrate that a biosimilar or a process change has not significantly altered the complex three-dimensional arrangement of the protein, heavily rely on CD spectroscopy. By comparing the far-UV and near-UV CD spectra of different batches or products, researchers can assess similarities and differences in both secondary and tertiary structures, a key requirement in analytical comparability studies and for meeting FDA guidelines on HOS comparability. CD spectral fingerprinting for biosimilars is a common practice, where the entire CD spectrum serves as a unique identifier for the molecule's conformation.
- Protein Folding and Stability Testing: Understanding how a protein folds and the factors that affect its stability is crucial throughout the drug development process. CD spectroscopy is extensively used in protein folding and stability testing. By monitoring the changes in the CD signal as a function of temperature (using thermal denaturation CD analysis) or the concentration of denaturants, researchers can gain insights into the protein's unfolding transitions and its overall stability. Shifts in the CD spectra under different conditions, such as pH stress CD spectral shifts, can reveal vulnerable regions of the protein and inform formulation strategies aimed at enhancing stability. Formulation stress testing often incorporates CD to assess the impact of various excipients and storage conditions on the protein's conformation.
Specific Applications for Biopharmaceutical Products
- CD spectroscopy for monoclonal antibodies (mAbs): Monoclonal antibodies are complex glycoproteins with multiple domains, making their structural characterization challenging. CD spectroscopy is invaluable for assessing the overall conformation and stability of mAbs, ensuring that the antigen-binding sites and Fc regions maintain their correct structures for optimal function and effector mechanisms.
- CD spectroscopy for nucleic acids: CD is also a powerful tool for studying the structure and stability of DNA and RNA molecules. The characteristic CD spectra of different nucleic acid conformations (e.g., A-form, B-form, Z-form) can be used to identify and quantify these structures. Furthermore, CD is particularly useful for G-quadruplex detection using CD, which are non-canonical DNA or RNA structures that are gaining increasing attention as potential therapeutic targets.
- mRNA vaccine quality control: The advent of mRNA vaccines has highlighted the need for robust analytical techniques to ensure the quality and integrity of the mRNA and its delivery system. CD spectroscopy is emerging as a valuable tool in this field, particularly for characterizing the structure of the mRNA molecule itself and for analyzing the structure and stability of lipid nanoparticle (LNP) analysis, which encapsulate and deliver the mRNA.
Drug-Target Interactions
Beyond characterizing the biopharmaceutical product itself, CD spectroscopy can also be employed to study how these molecules interact with their biological targets. By monitoring changes in the CD spectrum of a protein upon binding to a ligand or a drug, researchers can gain insights into conformational changes induced by the interaction, which can be crucial for understanding the binding mechanism and affinity.
Case Study 1: Structural Characterization of Therapeutic Antibodies Using CD Spectroscopy
A recent study exemplifies the power of CD spectroscopy in the structural analysis of monoclonal antibodies (mAbs). In this work, far-UV and near-UV synchrotron radiation CD (SRCD) spectra were obtained for 14 therapeutic mAbs under native (pH 7 or 5) and acid-stressed (pH 3) conditions. Despite all antibodies sharing a common IgG scaffold, significant variability in spectral features was observed, particularly in the intensity and presence of a far-UV positive peak at 201-202 nm and a near-UV exciton couplet at 230-240 nm.
Secondary structure analysis using the CDSSTR algorithm and SP175 reference set revealed that four mAbs (mAb7-9, 11) exhibited notable structural changes at low pH, including a 5-9% reduction in β-sheet content accompanied by increases in unordered and helical components. Interestingly, these conformational changes were corroborated by shifts in their CD spectra, particularly diminished 200 nm peaks and altered exciton signatures in the near-UV region. The findings highlight the sensitivity of CD to detect even subtle conformational rearrangements and underscore its utility as a process analytical technology (PAT) for monitoring mAb structural integrity during manufacturing.
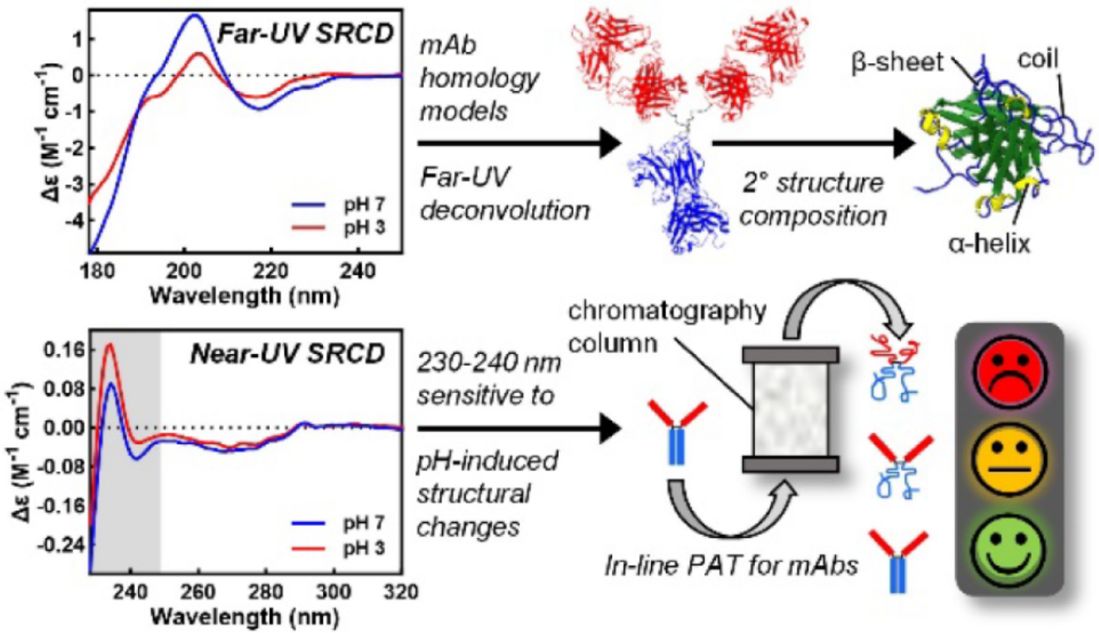 Figure 1. Synchrotron CD Analysis Reveals pH-Sensitive Structural Markers in Therapeutic Monoclonal Antibodies. (Bruque M G, et al., 2024)
Case Study 2: Fingerprint Identification of Therapeutic mAbs via Near-UV CD and Statistical Analysis
A study demonstrated the effectiveness of near-UV CD spectroscopy combined with statistical analysis in evaluating the higher-order structure (HOS) of therapeutic monoclonal antibodies. The researchers analyzed 14 IgG1 antibodies approved for clinical use, including adalimumab, bevacizumab, and rituximab. Although the heavy chains of these antibodies shared more than 88 percent sequence identity, each antibody exhibited a unique near-UV CD spectrum, reflecting distinct tertiary structures influenced by differences in aromatic residues such as tryptophan, tyrosine, and phenylalanine.
Principal component analysis (PCA) reduced the dimensionality of the spectral data while retaining 92.9 percent of the original variance. This allowed clear discrimination among the antibodies based on their spectral profiles. Quantitative comparisons using normalized Euclidean distances confirmed that all antibody pairs were statistically different. At the same time, the equivalence tests applied to different production lots of the same antibody showed no significant differences. These findings highlight the method's reliability for both identity testing and batch-to-batch comparability.
The results of this study support the use of near-UV CD as a sensitive and statistically robust tool for structural fingerprinting in the development and quality control of monoclonal antibody therapeutics.
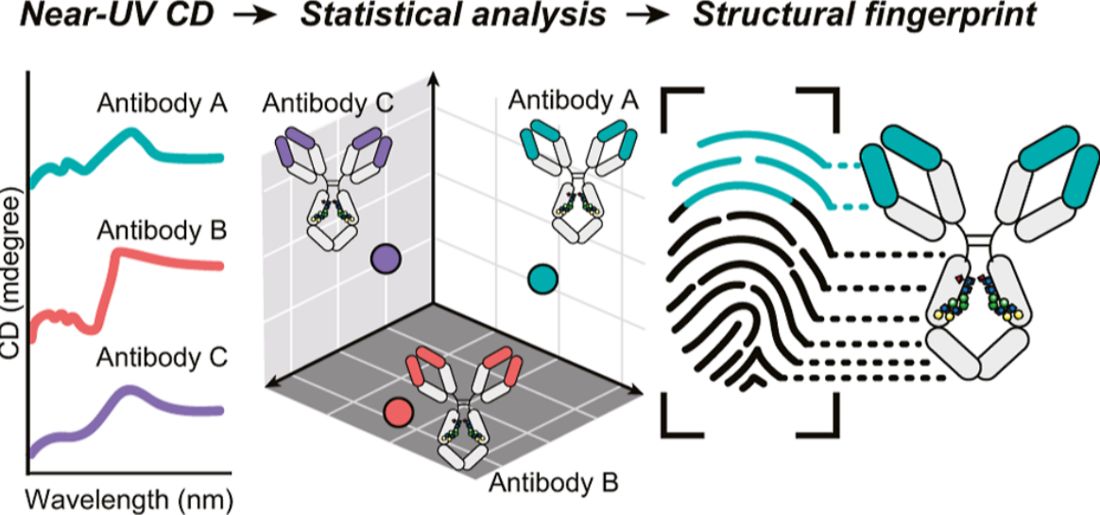 Figure 2. Near-UV Circular Dichroism Combined with Statistical Analysis for Fingerprinting the Higher-Order Structure of Therapeutic mAbs. (Kiyoshi M, et al., 2025)
CD in Biopharmaceutical Quality Control and Regulatory Compliance
Quality Control and Assurance
The sensitivity and reproducibility of CD spectroscopy make it well-suited for routine quality control in biopharmaceutical manufacturing. CD spectroscopy in biopharmaceuticals can be used to verify the consistency of protein conformation between different production batches, ensuring that the product meets predefined quality attributes. The technique can also be applied for real-time quality monitoring of critical process parameters that might affect protein structure. The ability to generate a CD spectral fingerprinting for biosimilars provides a powerful tool for confirming structural equivalence to the originator product.
Regulatory Frameworks and Best Practices
Regulatory agencies, such as the FDA and EMA, emphasize the importance of thorough structural characterization for biopharmaceuticals. Adherence to guidelines like USP <1055> CD method validation is crucial for ensuring the reliability and robustness of CD data. This includes establishing the specificity, linearity, accuracy, precision, and robustness of the CD method. Generating regulatory-compliant CD data is essential for successful regulatory submissions. Furthermore, conducting CD spectroscopy under GMP (Good Manufacturing Practices) ensures that the testing is performed according to established quality systems. The potential for inline circular dichroism for process monitoring represents a future direction that could further enhance quality control and reduce variability in biopharmaceutical manufacturing.
Advantages and Considerations of CD Spectroscopy in Biopharma
| Advantages | Considerations |
|---|---|
|
|
Future Perspectives of CD in Biopharma
The field of CD spectroscopy continues to evolve, with advancements in instrumentation leading to improved sensitivity and data acquisition rates. The development of sophisticated data analysis methods, including multivariate analysis of CD spectra, allows for more nuanced interpretation of complex spectral data and the extraction of subtle conformational differences. The integration of CD with other spectroscopic techniques in pharma R&D, such as fluorescence spectroscopy, Raman spectroscopy, and mass spectrometry, is providing increasingly comprehensive insights into the structure, dynamics, and interactions of biopharmaceutical molecules. Furthermore, the application of CD is expanding to novel therapeutic modalities, such as gene therapies and cell-based therapies, and in the characterization of complex drug delivery systems.
Conclusion
In conclusion, the application of CD in biopharma is both extensive and critical. From the detailed analysis of protein secondary structure analysis and higher-order structure (HOS) comparability to its crucial role in protein folding and stability testing, biosimilar structural analysis, and mRNA vaccine quality control, CD spectroscopy stands as a cornerstone technique. Its ability to provide rapid, sensitive, and non-destructive insights into the structural integrity of biologics, coupled with its importance in analytical comparability studies and ensuring regulatory-compliant CD data, underscores its indispensable role in enhancing the understanding, quality, and regulatory compliance of biopharmaceutical products. CD spectroscopy will remain a key tool in biopharmaceutical innovation, crucial for developing safe and effective therapeutics.
Whether you're developing biosimilars, assessing protein stability, or ensuring regulatory compliance, CD can provide the structural insights you need. Creative Biostructure offers professional CD spectroscopy services to support your biopharma R&D and QC needs. Contact us today to learn how we can assist your project.
References
- Joshi V, Shivach T, Yadav N, et al. Circular dichroism spectroscopy as a tool for monitoring aggregation in monoclonal antibody therapeutics. Analytical Chemistry. 2014, 86(23): 11606-11613.
- Kumagai P S, Araujo A P U, Lopes J L S. Going deep into protein secondary structure with synchrotron radiation circular dichroism spectroscopy. Biophysical Reviews. 2017, 9: 517-527.
- Miles A J, Janes R W, Wallace B A. Tools and methods for circular dichroism spectroscopy of proteins: a tutorial review. Chemical Society Reviews. 2021, 50(15): 8400-8413.
- Illodo S, Pérez-González C, Barcia R, et al. Spectroscopic characterization of mitochondrial G-quadruplexes. International Journal of Molecular Sciences. 2022, 23(2): 925.
- Linhares L A, Ramos C H I. Unlocking insights into folding, structure, and function of proteins through circular dichroism spectroscopy—a short review. Applied Biosciences. 2023, 2(4): 639-655.
- Bruque M G, Rodger A, Hoffmann S V, et al. Analysis of the Structure of 14 Therapeutic Antibodies Using Circular Dichroism Spectroscopy. Analytical Chemistry. 2024, 96(38): 15151-15159.
- Kiyoshi M, Oyama T, Shibata H, et al. The Structural Fingerprint of Therapeutic Monoclonal Antibodies Determined Using a Combination of Near-UV Circular Dichroism and Statistical Approach for Comparative Analysis. Analytical Chemistry. 2025.