Chirality, a fundamental property of many biological molecules, affects everything from drug interactions to protein folding. To study these structures, scientists use chiroptical techniques like Circular Dichroism (CD) and Optical Rotatory Dispersion (ORD). Both rely on polarized light to reveal molecular asymmetry but measure different optical effects. CD detects differences in absorption of circularly polarized light, while ORD measures the rotation of plane-polarized light. Understanding their differences helps researchers choose the right method for analyzing protein structures, chiral purity, and other key molecular features.
Understanding Optical Activity
Optical activity is a key property of chiral molecules. It describes their ability to interact differently with polarized light, a result of their molecular asymmetry. This characteristic is widely observed in biologically important compounds such as amino acids, nucleic acids, and sugars. When polarized light encounters a chiral molecule, it can be either rotated or absorbed to different extents depending on the molecule's handedness. These interactions form the basis of ORD and CD spectroscopy.
A clear understanding of these techniques begins with the nature of polarized light, which exists in two primary forms: plane-polarized and circularly polarized.
The Nature of Polarized Light
Plane-Polarized Light
Light is composed of oscillating electric and magnetic fields. In unpolarized light, these oscillations occur in all directions perpendicular to the direction of travel. When light passes through a polarizer, it becomes plane-polarized, meaning the electric field oscillates in only one plane.
This type of light can be broken down into two circularly polarized components. These are known as left circularly polarized light and right circularly polarized light. They rotate in opposite directions but have the same amplitude and frequency. When these two components are combined, their electric fields add together to produce a linear oscillation, which appears as plane-polarized light.
Circularly Polarized Light
Circularly polarized light differs from plane-polarized light in that its electric field rotates as it moves forward. In left circularly polarized light, the rotation is counterclockwise when viewed from the light source. In right circularly polarized light, the rotation is clockwise.
This rotational motion gives circularly polarized light its own form of chirality. As a result, chiral molecules interact differently with the two types of circularly polarized light. The mismatch in interaction is similar to how a left hand does not fit properly into a right-handed glove. This unequal interaction is what allows ORD and CD to detect and analyze chiral structures with high sensitivity.
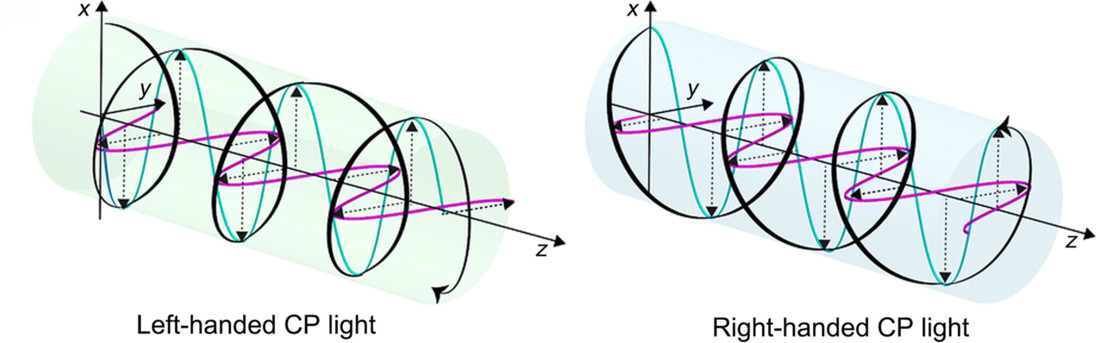 Figure 1. Visualization of Left- and Right-Handed Circularly Polarized Light and Their Electric Field Rotation.
Circular Dichroism (CD) Spectroscopy: Unveiling Differential Absorption
Principle of CD Spectroscopy
CD spectroscopy measures the differential absorption of left and right circularly polarized light as it passes through a chiral sample. When a chiral chromophore absorbs left circularly polarized light (L-CPL) and right circularly polarized light (R-CPL) to different extents, the difference in absorbance (ΔA=AL-AR) generates a CD signal.
This differential absorption is expressed as molar ellipticity (θ), typically in units of degrees·cm²/dmol, which is directly proportional to ΔA. The resulting CD spectrum, plotted as molar ellipticity versus wavelength, provides detailed insights into molecular conformation.
A key feature of CD is that a signal is only observed in spectral regions where the chiral molecule or its environment includes an absorbing chromophore. Therefore, even highly chiral molecules will not produce a CD signal if they lack relevant chromophores within the measured wavelength range. CD is especially powerful in analyzing the secondary and tertiary structures of proteins and nucleic acids due to their intrinsic chiral chromophores and ordered conformations.
Instrumentation of CD Spectroscopy
A CD spectrophotometer typically includes the following components:
- Light source: Often a xenon arc lamp.
- Monochromator: To select specific wavelengths.
- Polarizer and modulator: To generate left and right circularly polarized light.
- Sample cell: Usually quartz cuvettes.
- Detector: Photomultiplier tube or diode array detector.
Advanced instruments also include temperature controllers and automated sample changers, enabling kinetic and thermal stability studies.
Interpreting CD Spectra: Absorptive Peaks and Direct Structural Insights
CD spectra are characterized by "absorptive" or "Gaussian-like" peaks and troughs, which directly correspond to the electronic transitions of the chromophore. For example, in the far-UV region (180-250 nm), the CD spectra of proteins are dominated by the absorption of the peptide bond, providing highly sensitive information about the protein's secondary structure.
The sign (positive or negative) and magnitude of a CD peak are directly related to the chirality of the chromophore and its local environment. For proteins, distinct CD spectral patterns are associated with different secondary structural elements:
- Alpha-helices: Typically show characteristic double minima at 208 nm and 222 nm, and a positive maximum at 193 nm.
- Beta-sheets: Often exhibit a negative minimum around 217 nm and a positive maximum around 195 nm.
- Random coils: Characterized by a strong negative band near 195 nm and very low ellipticity at longer wavelengths.
This direct correlation between CD signals and specific structural motifs makes CD spectroscopy an invaluable tool for studying protein folding, conformational changes, and interactions.
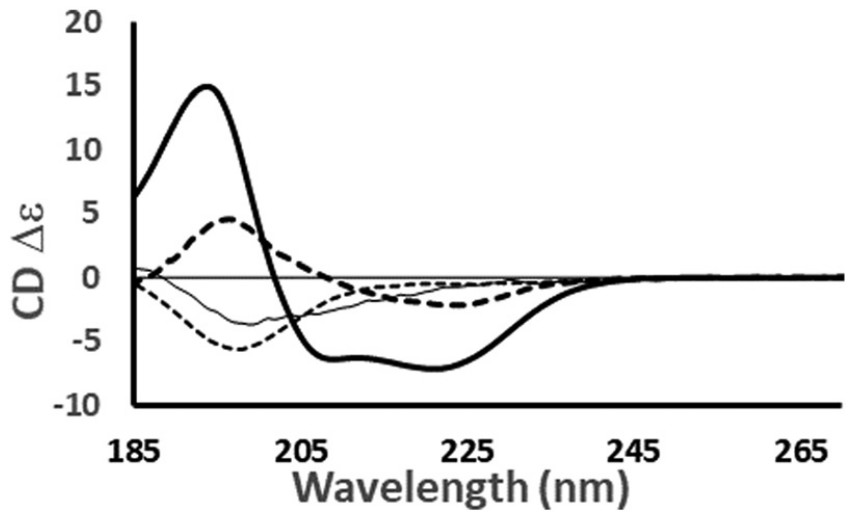 Figure 2. Circular Dichroism Spectra of Proteins with Distinct Secondary Structures. Representative CD spectra of proteins with different dominant secondary structures: haemoglobin (helical), concanavalin A (anti-parallel β-sheet), elastase (right-handed twisted β-sheet), and HASPA (disordered). Data were sourced from the Protein Circular Dichroism Data Bank (PCDDB) with respective accession codes: CD0000037000, CD0000020000, CD0000031000, and CD0005282000. Spectral shapes reflect the composite contributions of structural elements; notable features include a ~222 nm negative peak for α-helices and a ~200 nm minimum for disordered regions. (Miles A J, et al., 2021)
Applications of CD Spectroscopy
The ability of CD to provide direct insights into the secondary and tertiary structure of biomolecules is its greatest strength. Researchers can:
- Quantify Secondary Structure: Estimate the percentage of alpha-helix, beta-sheet, turns, and random coil content in a protein.
- Monitor Protein Folding/Unfolding: Track changes in conformation induced by temperature, pH, denaturants, or ligand binding.
- Study Ligand Binding: Observe induced conformational changes in a protein upon binding to a small molecule or another macromolecule.
- Assess Protein Stability and Thermostability: Determine the melting temperature (Tₘ) of proteins, an indicator of their thermal stability.
- Analyze Nucleic Acid Conformation: Investigate the helicity and supercoiling of DNA and RNA.
- Evaluate Biosimilarity: Compare the higher-order structure of biosimilar drug candidates to their reference products.
Select Service
Related Reading
Optical Rotatory Dispersion (ORD) Spectroscopy: Measuring Rotation Over Wavelength
Principle of ORD Spectroscopy
ORD is a technique that measures the rotation of the plane of linearly polarized light as it travels through a chiral medium over a range of wavelengths. This rotation occurs because chiral substances exhibit circular birefringence, meaning they have different refractive indices for left and right circularly polarized light. As a result, these two components propagate at different velocities, leading to a phase difference between them.
When the left and right circularly polarized components recombine after passing through the chiral sample, their vector sum remains plane-polarized, but the plane of polarization is rotated relative to its original orientation. This optical rotation, denoted by α and expressed in degrees, varies with wavelength. By plotting the angle of rotation against wavelength, an ORD curve is generated, which reflects the chiral and electronic properties of the sample.
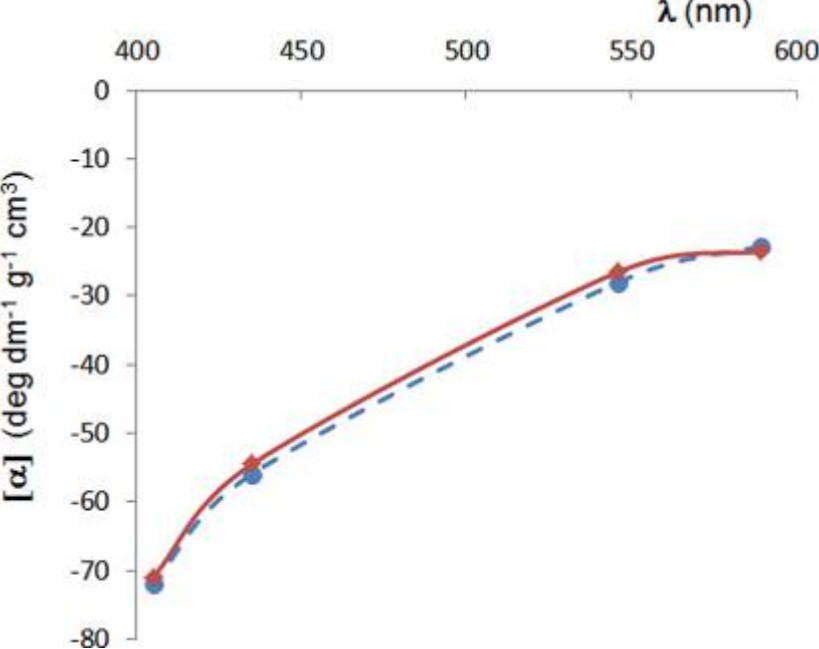 Figure 3. Optical Rotatory Dispersion (ORD) Curve. Comparison of calculated ORD curve (dashed blue line) with experimental ORD data (solid red line), demonstrating optical rotation as a function of wavelength. (Mazzeo G, et al., 2013)
Instrumentation of ORD Spectroscopy
ORD instruments share similarities with CD setups, but key differences include:
- Linear polarizer instead of a circular modulator.
- Analyzer to measure the rotation of the plane-polarized light after it exits the sample.
- Wavelength range: Often extends into regions not accessible to CD (e.g., visible light), making it suitable for compounds without strong UV absorbance.
Interpreting ORD Spectra: Dispersive Curves and the Cotton Effect
ORD spectra are characterized by their "dispersive" or "S-shaped" curves. Away from an absorption band of a chiral chromophore, the specific rotation generally changes smoothly with wavelength. However, when the wavelength of the incident light approaches an absorption band, a phenomenon known as the Cotton Effect is observed.
The Cotton Effect manifests as an anomalous dispersion, characterized by a characteristic peak and trough (or vice versa) in the ORD curve centered around the absorption maximum. If the specific rotation becomes more positive as the wavelength decreases, and then turns negative, it's termed a positive Cotton effect. Conversely, if it becomes more negative then positive, it's a negative Cotton effect. The sign and magnitude of the Cotton effect provide information about the absolute configuration and conformation of the chiral chromophore.
Historically, ORD was instrumental in determining the absolute configuration of small chiral molecules and investigating conformational changes. However, for detailed structural analysis, particularly in complex biomolecules, its interpretation can be more challenging compared to CD.
Applications of ORD Spectroscopy
- Absolute configuration: ORD is used to determine the stereochemistry of organic compounds.
- Carbohydrate and alkaloid analysis: Particularly useful in natural product chemistry.
- Pharmaceutical quality control: Assessing enantiomeric purity.
Direct Comparison: CD vs. ORD - A Side-by-Side View
| Feature | Circular Dichroism (CD) | Optical Rotatory Dispersion (ORD) |
|---|---|---|
| Basis of Measurement | Differential absorption; Differential absorption of circularly polarized light. | Differential refractive index; Rotation of plane-polarized light. |
| Light Used | Left and right circularly polarized light. | Plane-polarized light (interpreted as L-CPL + R-CPL). |
| Spectral Output | Absorptive, Gaussian-like peaks and troughs. | Dispersive, S-shaped curves (Cotton effect). |
| Information Provided | Detailed secondary/tertiary structure; conformational changes; chiral chromophore environment. | Historically, absolute configuration; overall optical activity. |
| Ease of Interpretation | Generally simpler due to direct peak correspondence with absorption bands and known structural motifs. | Can be complex, especially with overlapping Cotton effects. |
| Sensitivity | Often more sensitive for detailed structural analysis of biomolecules. | Good for overall optical activity. |
| Spectral Range | Far-UV (180-250 nm for proteins) to Near-UV/Vis. | Typically UV-Vis (often extended to IR). |
Why CD Spectroscopy Is Preferred in Biomolecular Analysis
In modern biomolecular research, CD spectroscopy is generally preferred over ORD for several key reasons:
- Direct Structural Correlation: CD spectra provide direct and easily interpretable insights into secondary structural elements in proteins and nucleic acids, making it a powerful tool for conformational analysis.
- Simpler Interpretation: CD bands directly correspond to electronic transitions within the chromophore's absorption range, making spectral assignment and interpretation more straightforward, especially when multiple chiral chromophores or conformational transitions are involved.
- Sensitivity to Conformational Changes: Small changes in molecular conformation often result in significant and well-resolved changes in CD spectra, allowing for sensitive monitoring of processes like protein folding, unfolding, and ligand binding.
- Quantitative Analysis: CD data can be deconvoluted using various algorithms to estimate the percentage of different secondary structure elements, providing quantitative structural information.
While ORD still holds its place in certain applications, particularly for absolute configuration determination of smaller, well-defined chiral molecules, CD has become the workhorse for understanding the dynamic structural behavior of complex biomacromolecules.
Conclusion
Both Optical Rotatory Dispersion (ORD) and Circular Dichroism (CD) are valuable tools for studying molecular chirality, each based on different physical principles. ORD detects optical rotation caused by differential refraction, while CD measures differential absorption linked directly to molecular structure.
Among the two, CD has become the preferred technique in modern biomolecular research due to its ability to provide clear, sensitive, and structure-specific information. It is especially powerful for analyzing proteins, nucleic acids, and other complex chiral systems.
For advanced analysis and comprehensive insights into the higher-order structure of your biomolecules, explore Creative Biostructure's cutting-edge CD spectroscopy services, tailored to meet your specific research needs. Contact us today to discuss your project or request a quote.
References
- Wolf C, Bentley K W. Chirality sensing using stereodynamic probes with distinct electronic circular dichroism output. Chemical Society Reviews. 2013, 42(12): 5408-5424.
- Mazzeo G, Santoro E, Andolfi A, et al. Absolute configurations of fungal and plant metabolites by chiroptical methods. ORD, ECD, and VCD studies on phyllostin, scytolide, and oxysporone. Journal of Natural Products. 2013, 76(4): 588-599.
- Miles A J, Janes R W, Wallace B A. Tools and methods for circular dichroism spectroscopy of proteins: a tutorial review. Chemical Society Reviews. 2021, 50(15): 8400-8413.
- Ghosh S, Herink G, Perri A, et al. Broadband optical activity spectroscopy with interferometric Fourier-transform balanced detection. ACS Photonics. 2021, 8(8): 2234-2242.
- Linhares L A, Ramos C H I. Unlocking insights into folding, structure, and function of proteins through circular dichroism spectroscopy—a short review. Applied Biosciences. 2023, 2(4): 639-655.
- Junior F M S, Junior J M B. Absolute configuration from chiroptical spectroscopy. Chiral Separations and Stereochemical Elucidation: Fundamentals, Methods, and Applications. 2023: 551-591.