Dynamic Light Scattering (DLS)-Based Exosome Characterization Service
Dynamic light scattering is a powerful analytical technique that provides rapid and non-invasive measurement of exosome size distribution and colloidal stability. At Creative Biostructure, we leverage this technology to deliver critical data for assessing the quality and behavior of your extracellular vesicle (EV) preparations, ensuring you can proceed in your research with confidence.
What is Dynamic Light Scattering for Exosome Analysis?
Dynamic Light Scattering (DLS), also known as Photon Correlation Spectroscopy (PCS), is a cornerstone technique for the characterization of nanoparticles, including exosomes and other extracellular vesicles. It serves as a rapid, first-line analytical tool to determine the hydrodynamic diameter (Dh) and size distribution of vesicles suspended in a liquid. For researchers working with exosomes, DLS is indispensable for routine quality control, allowing for the quick identification of sample monodispersity and the detection of unwanted aggregates that can impact experimental outcomes.
How DLS Measures Exosome Size
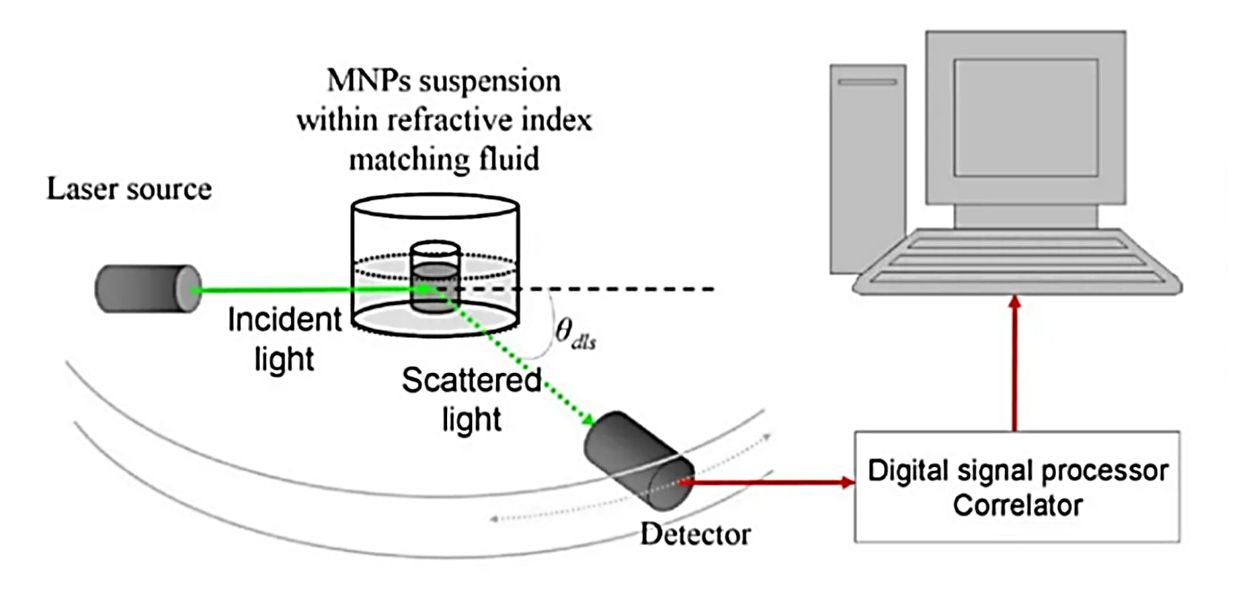
The principle of DLS is based on the Brownian motion of particles, which describes their random movement in a fluid. Our advanced systems follow a precise process to measure exosome size:
- Laser Illumination: A monochromatic laser illuminates the exosome sample.
- Light Scattering: The laser light scatters off the exosomes. Because of Brownian motion, the intensity of the scattered light fluctuates. Smaller particles move faster, causing rapid fluctuations, while larger particles move slower, causing gradual fluctuations.
- Signal Correlation: A sensitive detector records these intensity fluctuations. An autocorrelator then analyzes the signal to generate a correlation function that quantifies the rate of these fluctuations.
- Size Calculation: From the correlation function, the translational diffusion coefficient (D) of the particles is calculated. This value is then converted into the hydrodynamic diameter (Dh) using the Stokes-Einstein equation. The Dh represents the size of a sphere that would diffuse at the same rate as the measured exosome.
Understanding DLS Data
- Z-Average: Intensity-weighted mean size; sensitive to large particle presence.
- Polydispersity Index (PDI): Ranges 0.0-1.0; values <0.3 indicate homogeneity, <0.2 are excellent.
- Distribution Peaks: A narrow single peak indicates uniformity; a second larger peak (>1 µm) signals aggregation.
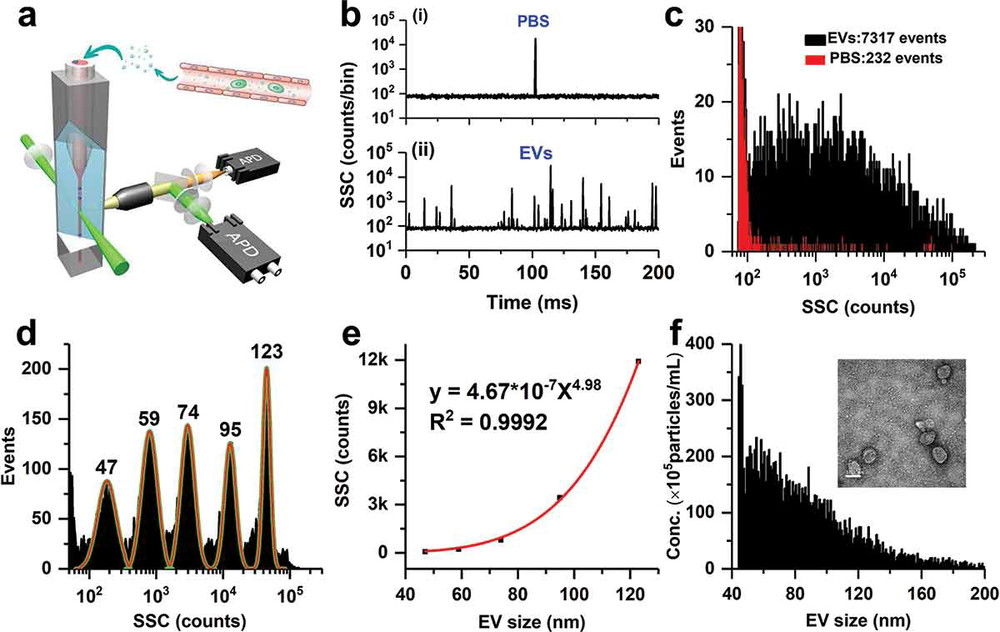
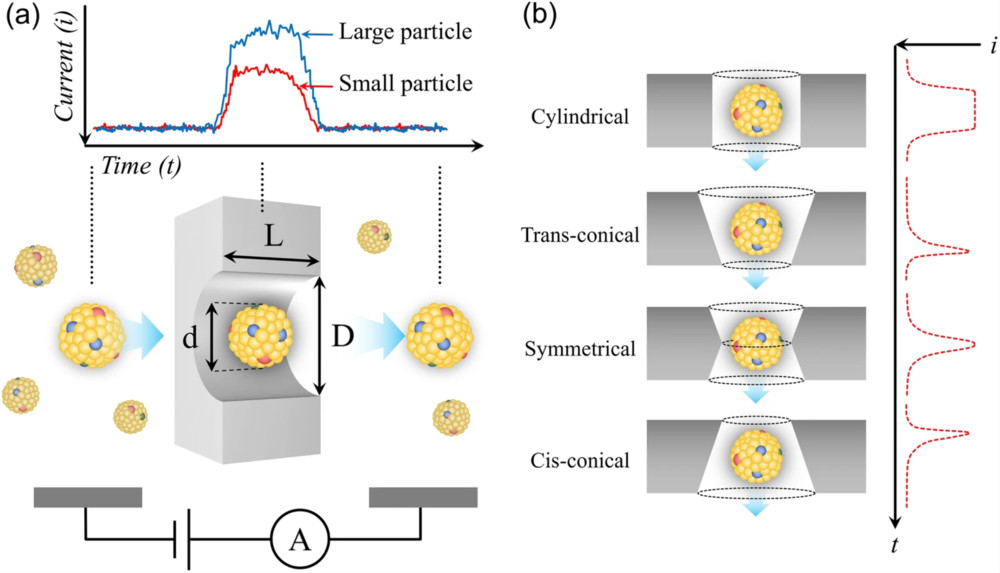
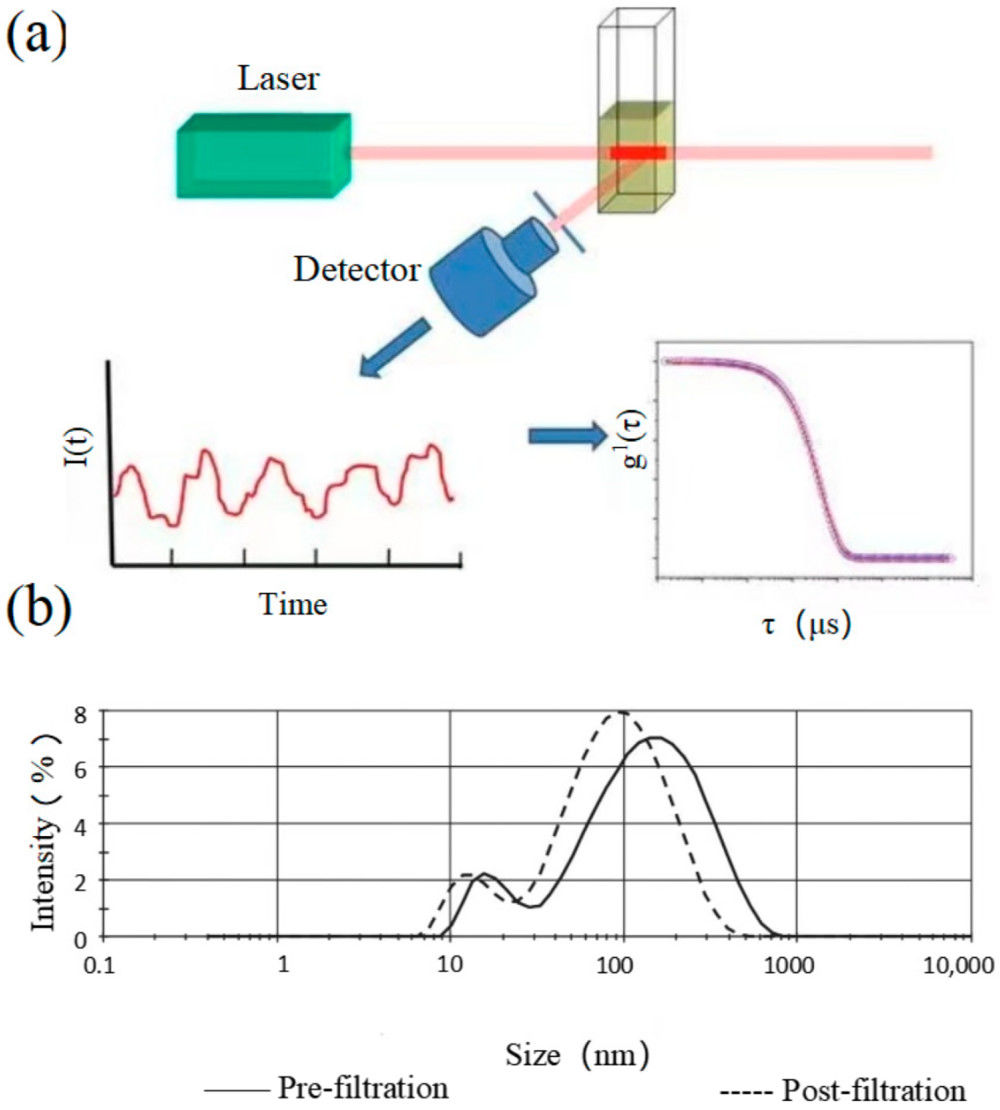 Figure 1. DLS for extracellular vesicle analysis. (a) Principle of DLS measuring size distribution from scattered light fluctuations. (b) Size distribution of microparticles in fresh-frozen plasma showing heterogeneity and abundance. (Wu S, et al., 2024)
How DLS Compares to Other Exosome Characterization Methods
| Feature | DLS | NTA | TEM |
|---|---|---|---|
| Principle | Ensemble light scattering | Single-particle scattering | Direct imaging |
| Primary Output | Hydrodynamic diameter | Diameter + concentration | Morphology |
| Speed | Minutes | Moderate | Hours-days |
| Strengths | Fast, detects aggregates | Concentration + size | Structural detail |
| Considerations | Biased toward larger particles | Limited concentration range | Requires fixation/staining |
DLS complements, rather than replaces, these methods in a comprehensive exosome characterization strategy.
Our DLS Exosome Characterization Service
Step-by-Step DLS Exosome Characterization Workflow
Project Consultation
Our experts assess your research goals and sample suitability, advising on buffer conditions and complementary methods.
Sample Preparation and Initial QC
Samples are carefully handled and checked for purity, concentration, and buffer compatibility to reduce background noise.
Instrument Setup and Calibration
DLS systems are calibrated with size standards before each run to ensure accuracy and reproducibility.
DLS Measurement
Exosomes are illuminated with a monochromatic laser, and time-dependent fluctuations of scattered light intensity are recorded. Multiple acquisitions are performed to minimize variability, with attention to scattering angle and acquisition time.
Data Processing & Interpretation
Autocorrelation functions are processed using validated algorithms to extract key parameters, including hydrodynamic diameter (Z-average), polydispersity index (PDI), and qualitative aggregate detection. Our experts interpret results in the context of exosome research, highlighting limitations and complementary methods when appropriate.
Reporting and Data Delivery
You receive a publication-ready report including size distribution graphs, Z-average, PDI, and aggregation notes, plus raw data upon request.
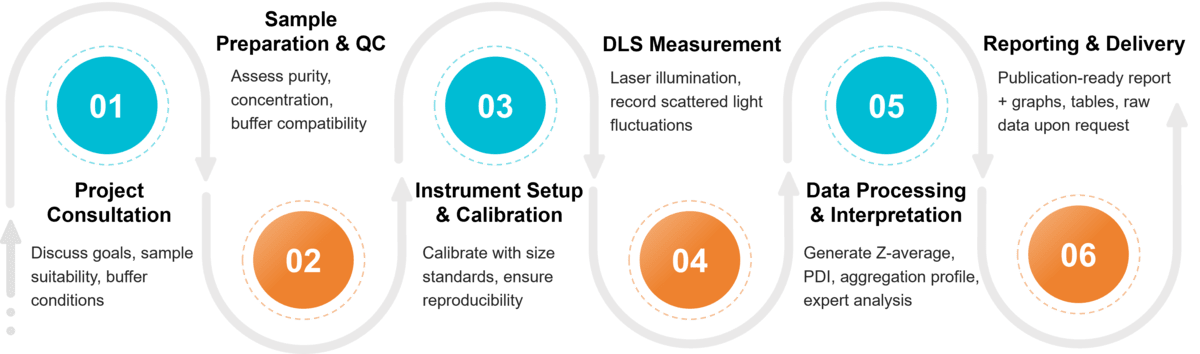 Figure 2. Project Workflow for DLS Exosome Characterization. (Creative Biostructure)
Quality and Compliance Standards
Our DLS characterization service adheres to rigorous standards, including:
- Alignment with MISEV2023 recommendations for EV analysis and reporting.
- Strict compliance with ISO 22412:2017 for DLS methodology and terminology.
- Transparent documentation of all measurement conditions (e.g., laser wavelength, scattering angle, acquisition settings).
- Expert interpretation that distinguishes true vesicle signals from background artifacts or protein aggregates.
Sample Requirements for DLS Analysis
To ensure reliable and reproducible results, please follow the sample submission guidelines below.
| Requirement | Description |
|---|---|
| Sample Type | Purified exosomes or pre-cleared biological fluids (e.g., plasma, culture supernatant) |
| Purity | Free of apoptotic bodies, debris, and excessive protein contaminants |
| Concentration | 108-1012 particles/mL for robust detection |
| Volume | Minimum of 20-50 µL per run |
| Buffer Conditions | Filtered physiological buffer (e.g., PBS) without detergents or high salt |
| Storage & Shipping | Fresh samples preferred; frozen aliquots acceptable at -80 °C; ship on dry ice |
What Deliverables Will You Receive
- Publication-ready DLS report with graphs, tables, and key parameters
- Expert commentary on Z-average, PDI, and aggregation tendencies
- Recommendations for complementary methods (NTA, TEM, etc.)
- Raw and processed DLS datasets (optional)
- Technical report ensuring reproducibility and compliance with international standards
Leveraging DLS in Your Exosome Workflow
Our DLS service provides actionable insights across the entire exosome research and development pipeline:
- Quality Control: Assess purity and consistency of exosome isolates.
- Stability Studies: Monitor aggregation and size changes under different storage or buffer conditions.
- Formulation Development: Verify encapsulation success in therapeutic exosome formulations.
- Comparative Analysis: Compare exosomes from different cell sources or isolation workflows.
- Pre-Screening: Use DLS as a rapid screen before advanced analyses like NTA, TEM, or proteomics.
Why Choose Creative Biostructure?
- Expert-Led Analysis: Ph.D. scientists with deep EV characterization expertise.
- State-of-the-Art Instrumentation: Sensitive DLS systems requiring low sample volumes.
- Rapid Turnaround: Efficient workflows to keep projects moving.
- Publication-Ready Data: Clear, ISO- and MISEV-compliant reports.
- Collaborative Support: Guidance from experimental design to data interpretation.
Case Study
Case: Characterization of Fibrosarcoma-Derived Exosomes Using DLS
Background
Exosomes from fibrosarcoma are poorly studied, and reliable size assessment is vital for understanding their roles.
Methods
Exosomes from WEHI-164 fibrosarcoma cells were validated by dot blot (GM1), Western blot (TSG101, HSC70), ExoView (CD9, CD63, CD81), and TEM imaging.
Results
TEM showed radii of ~50-67 nm, while DLS measured larger mean radii (94.4 nm for WEHI-164, 107.8 nm for MDA-MB-231) with >92% homogeneity. DLS consistently reported ~40 nm larger sizes than TEM.
Conclusion
DLS proved a rapid, non-invasive tool for assessing exosome size and aggregation, complementing imaging methods and supporting routine quality control.
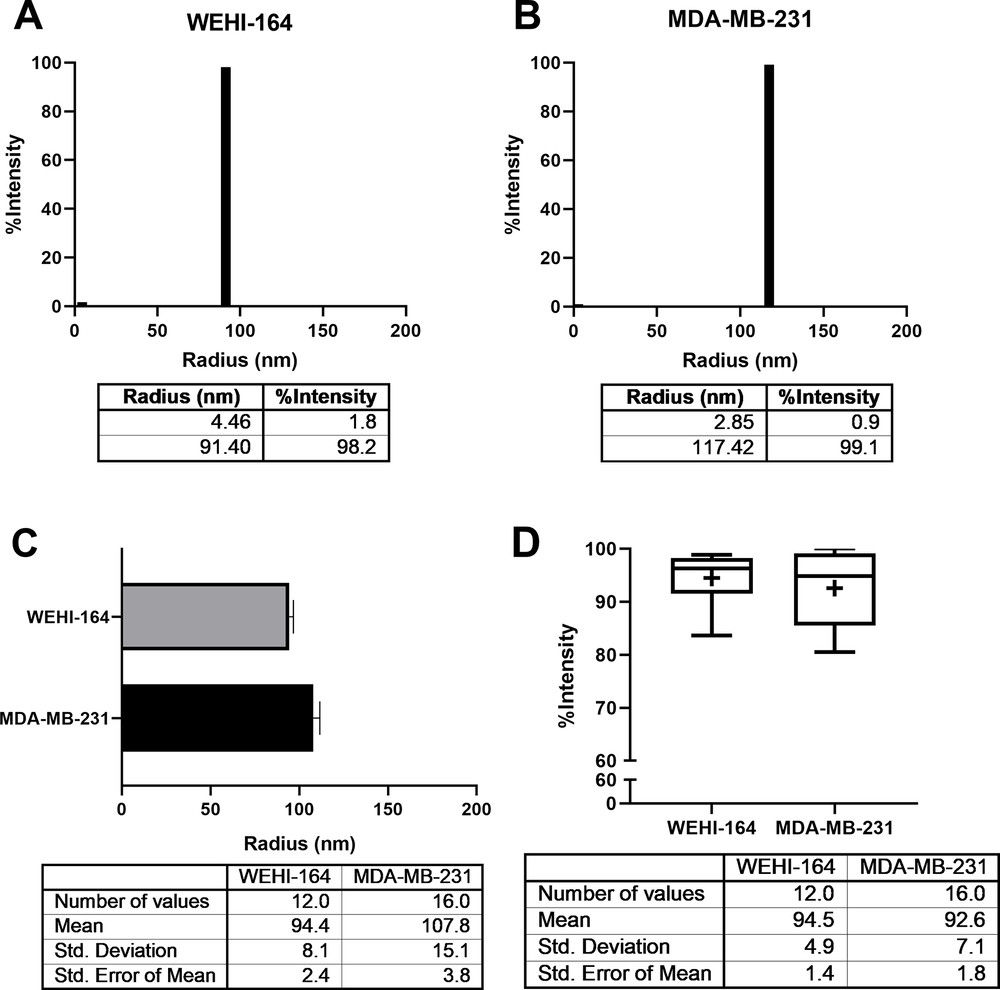 Figure 3. DLS analysis of exosomes. (A-B) Representative size distribution profiles of exosomes from WEHI-164 and MDA-MB-231 cell lines, showing major populations around 90-120 nm. (C) Mean radius comparison: WEHI-164 (94.4 nm, N = 7, n = 12) vs. MDA-MB-231 (107.8 nm, N = 13, n = 16). (D) Mean intensity of ~100 nm exosomes: WEHI-164 (94.5%) and MDA-MB-231 (92.6%). (Lyu T S, et al., 2021)
At Creative Biostructure, we combine advanced instrumentation with expert analysis to provide high-quality DLS exosome characterization services. Whether you are conducting basic EV research, developing therapeutic formulations, or performing pre-screening before advanced assays, our team ensures accurate, reproducible, and publication-ready data. Contact us to discuss your project or request a free consultation with our experts.
References
- Hassan P A, Rana S, Verma G. Making sense of Brownian motion: colloid characterization by dynamic light scattering. Langmuir. 2015, 31(1): 3-12.
- Lyu T S, Ahn Y, Im Y J, et al. The characterization of exosomes from fibrosarcoma cell and the useful usage of Dynamic Light Scattering (DLS) for their evaluation. PLoS One. 2021, 16(1): e0231994.
- Welsh J A, Goberdhan D C I, O'Driscoll L, et al. Minimal information for studies of extracellular vesicles (MISEV2023): From basic to advanced approaches. Journal of Extracellular Vesicles. 2024, 13(2): e12404.
- Wu S, Zhao Y, Zhang Z, et al. The advances and applications of characterization technique for exosomes: from dynamic light scattering to super-resolution imaging technology. Photonics. MDPI, 2024, 11(2): 101.
Frequently Asked Questions
For any inquiries, our support team is ready to help you get technical support for your research and maximize your experience with Creative Biostructure.