FACS-Based Exosome Characterization Service
Exosomes are nanoscale extracellular vesicles (EVs) that carry proteins, lipids, and nucleic acids to mediate cell-to-cell communication. Their heterogeneity and functional diversity are central to roles in tumor biology, immune modulation, and biomarker development. Understanding the surface composition and subpopulation distribution of exosomes is therefore critical for both fundamental research and translational applications.
Creative Biostructure provides FACS-based exosome characterization service to deliver in-depth analysis of exosomal surface proteins. By using fluorescence-activated cell sorting (FACS), our platform allows multiplexed labeling, semi-quantitative profiling, and subpopulation classification, in full compliance with MISEV2023 recommendations and the MIFlowCyt-EV reporting framework.
What is FACS-Based Exosome Characterization?
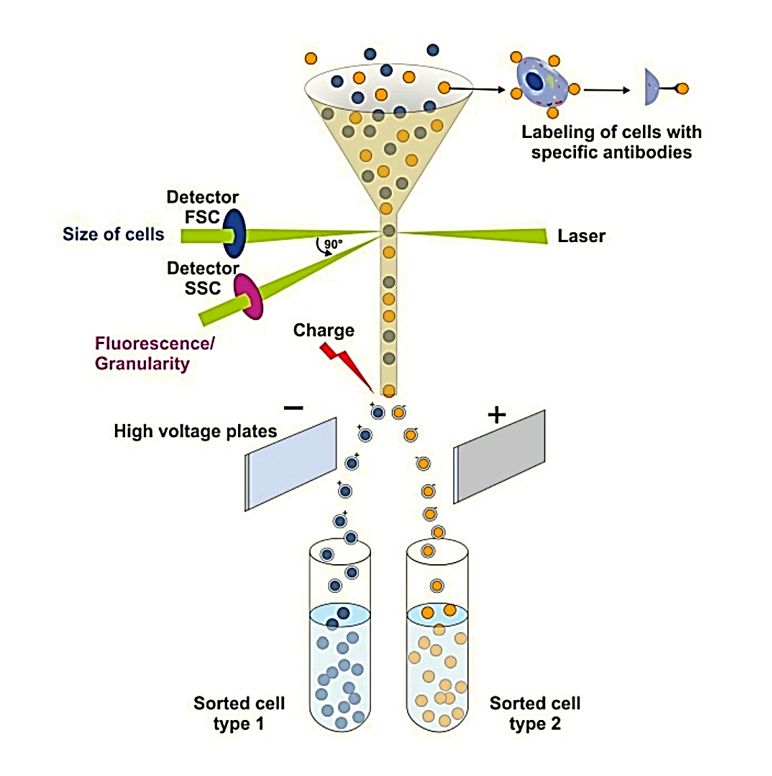
Fluorescence-Activated Cell Sorting (FACS) extends the capabilities of conventional flow cytometry to enable fluorescent labeling and sorting of exosome subtypes. Although originally developed for cell analysis, modern flow cytometers equipped with optimized optics and calibration strategies allow reliable detection of nanoscale vesicles.
Two complementary approaches are typically applied:
- Bead-based FACS: Exosomes are captured on antibody-coated beads and analyzed for multiple markers in parallel, suitable for profiling a broad panel of surface proteins.
- Single-vesicle FACS: With high-sensitivity instruments, exosomes above ~100 nm can be analyzed directly at near-single-particle resolution, providing information on marker density and distribution.
This dual strategy makes FACS one of the most versatile tools for exosome surface marker analysis, particularly where immune profiling, tumor biomarker validation, or subpopulation typing are required.
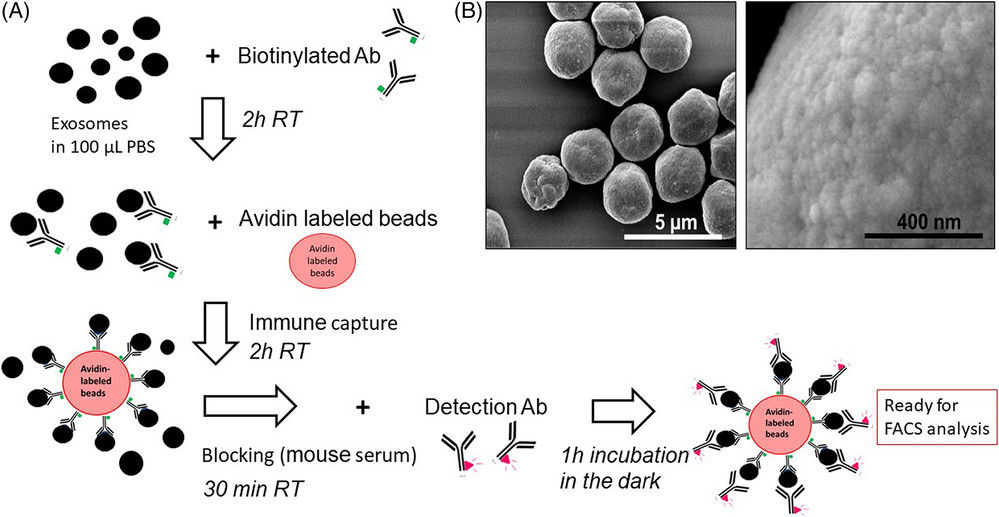 Figure 1. Immune Capture and On-Bead Flow Cytometry for Exosome Cargo Detection. (A) Workflow of immune capture and on-bead flow cytometry for exosome analysis. (B) Scanning electron microscopy (SEM) visualization of exosomes densely packed on bead surfaces. (Theodoraki M N, et al., 2021)
Why Choose FACS for Exosome Characterization?
Compared with bulk biochemical assays, FACS provides distinctive advantages:
- Multiplex profiling: Simultaneous detection of multiple fluorescent markers, allowing classification of heterogeneous exosome populations.
- Subpopulation analysis: Ability to distinguish exosomes of different cellular origins (e.g., tumor-derived vs. immune-derived vesicles).
- Semi-quantitative evaluation: Fluorescence intensity reflects relative marker abundance, enabling comparative analysis across samples.
- Sorting capability: Certain platforms allow isolation of exosome-enriched bead complexes or larger vesicle subsets for downstream assays.
- Flexibility: Applicable to a wide range of surface markers, including classical tetraspanins (CD9, CD63, CD81) and disease-associated molecules (EpCAM, HER2, PD-L1, integrins).
Our FACS Exosome Characterization Service
At Creative Biostructure, we offer tailored FACS workflows optimized for reproducibility and compliance. Our service emphasizes rigorous controls, calibration, and transparent reporting, ensuring reliable results that align with international standards.
Step-by-Step Workflow of Our FACS Exosome Characterization
Consultation & Experimental Design
Define project goals, select marker panels, and determine the appropriate approach (bead-based or single-vesicle FACS).
Sample Preparation & Exosome Isolation
Samples such as plasma, serum, urine, or cell culture supernatants can be submitted. If required, we can provide exosome isolation and purification services.
Fluorescent Labeling
Exosomes or bead complexes are incubated with fluorophore-conjugated antibodies. Controls include isotype antibodies, unstained samples, and titration tests.
FACS Data Acquisition
Multiplex fluorescence and light scatter data are recorded under optimized gating conditions to ensure single-particle discrimination.
Data Processing & Subpopulation Analysis
Marker expression is quantified as normalized fluorescence intensity (MESF values when applicable). Subpopulations are identified, and comparative statistics are generated.
Result Delivery
Clients receive a structured report including raw data, processed outputs, histograms, scatter plots, and expert interpretation.
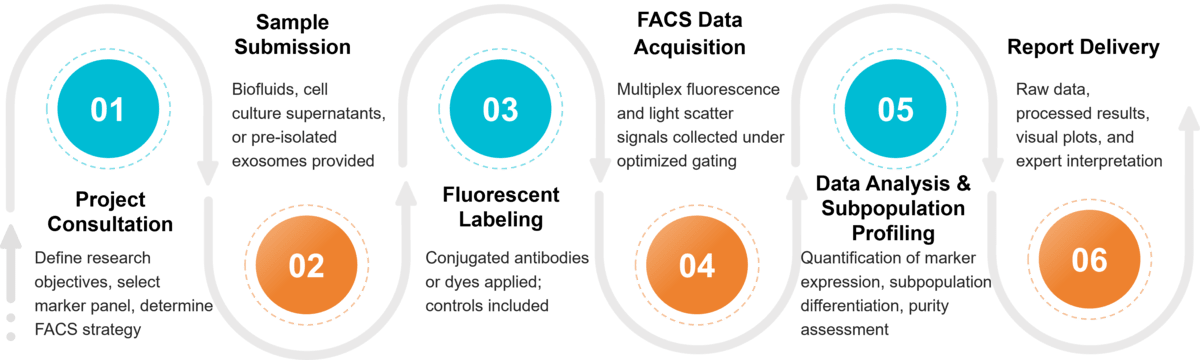 Figure 2. Project Workflow for FACS Exosome Characterization. (Creative Biostructure)
Sample Requirements for FACS Assay
To ensure optimal results, we recommend:
| Parameter | Requirement |
|---|---|
| Volume | ≥ 50 μL per assay |
| Concentration | ≥ 5 × 10⁹ particles/mL (by NTA) or ≥ 5 μg protein per assay (by BCA) |
| Sample Types | Plasma, serum, urine, cerebrospinal fluid, cell culture supernatant, purified EVs |
| Preservation | Fresh or stored at -80 °C; avoid repeated freeze-thaw cycles |
What Deliverables Will You Receive
Clients will receive a full data package including:
- Fluorescence intensity profiles of selected surface markers
- Subpopulation distribution plots and comparative marker analysis
- Purity assessment and detection of contaminating particles
- Detailed methodological parameters following MIFlowCyt-EV standards
Applications of FACS in Exosome Research
- Biomarker validation: Detection of disease-specific exosomal proteins for diagnostics and prognosis.
- Cancer research: Identification of tumor-derived exosomes expressing EpCAM, HER2, PD-L1, and other oncogenic markers.
- Immune profiling: Characterization of immune-cell derived exosomes to study immune regulation and inflammatory pathways.
- Drug delivery systems: Verification of engineered exosomes for targeted therapy and safety evaluation.
- Basic science: Exploration of vesicle heterogeneity and cell-to-cell signaling mechanisms.
FACS vs Nano-Flow Cytometry and Other Exosome Characterization Techniques
| Technique | Resolution | Parameters Measured | Throughput | Sorting Capability | Best Suited For |
|---|---|---|---|---|---|
| FACS | ~100 nm (direct, depending on instrument); Bulk-level with bead capture | Multiplex surface marker profiling, subpopulation classification, semi-quantitative intensity | Medium-High | Yes (for bead complexes or larger EVs) | Exosome subpopulation typing, immune profiling, biomarker validation |
| Nano-Flow Cytometry (nFCM) | ~40 nm | Size distribution, absolute concentration, fluorescence-based marker detection | High | No | Single-vesicle quantitative analysis, therapeutic EV quality control |
| Bead-based Flow Cytometry | >100 nm (bead-EV complexes) | Bulk surface marker detection (semi-quantitative only) | High | No | Confirmatory marker analysis, routine surface protein profiling |
| Nanoparticle Tracking Analysis (NTA) | ~70 nm | Particle size & concentration | Medium | No | General EV sizing and concentration estimation |
| Transmission Electron Microscopy (TEM) / Atomic Force Microscopy (AFM) | ~1-2 nm | Morphology, ultrastructure | Low | No | Structural validation, visual confirmation of vesicle integrity |
Key Features of Our Service
- Multiplex resolution: Parallel analysis of classical and disease-related markers.
- Subpopulation insights: Identify and classify exosome subsets by origin.
- Reproducible data: Controlled conditions and calibrated fluorescence reporting.
- Sorting capability: Isolate bead-bound vesicles or larger EV subsets for follow-up assays.
- Compliance: Fully aligned with MISEV2023 and MIFlowCyt-EV reporting standards.
- Trusted expertise: A multidisciplinary team experienced in exosome biology, immunology, and cytometry.
Case Study
Case: FACS Analysis of Ovarian Exosomes in Chemotherapy-Induced POI
In a mouse model of primary ovarian insufficiency (POI) induced by cyclophosphamide and busulfan, ovarian exosomes were isolated and confirmed by TEM, Western blot, and FACS detection of CD63/CD81. High-throughput sequencing revealed a >32-fold increase of exosomal miR-122-5p in the POI group. FACS apoptosis assays showed that exosomes from healthy ovaries reduced granulosa cell death, while POI-derived exosomes aggravated apoptosis. Inhibition of miR-122-5p restored BCL9 expression and protected cells. This study demonstrates how FACS is essential for both exosome marker validation and quantitative analysis of functional effects, highlighting its value in mechanistic and biomarker research.
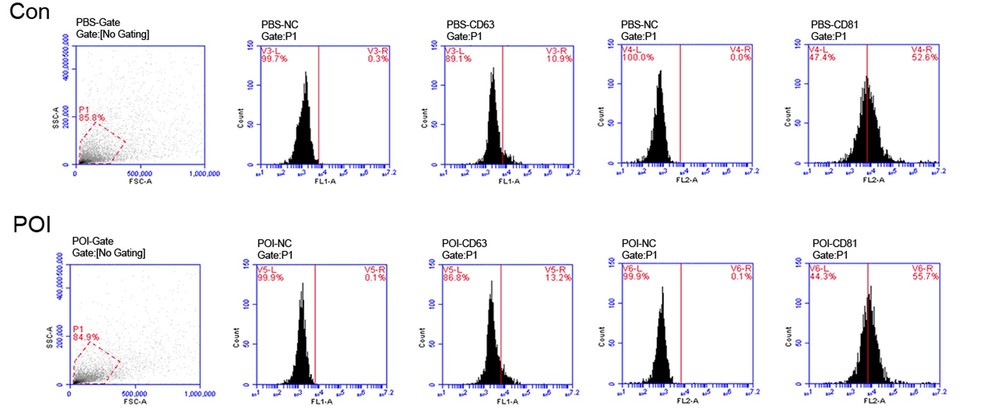 Figure 3. FACS analysis of exosome surface markers. Results confirmed that exosomes were positive for CD63 and CD81, two classical tetraspanin proteins widely used to validate exosome identity. (Zhang X, et al., 2022)
Creative Biostructure provides tailored FACS-based solutions for exosome research, from surface marker profiling to subpopulation analysis. Our scientists ensure accurate, reproducible results that advance biomarker discovery, immune studies, and therapeutic development. Contact us and explore how our expertise can accelerate your exosome projects.
References
- Theodoraki M N, Hong C S, Donnenberg V S, et al. Evaluation of exosome proteins by on‐bead flow cytometry. Cytometry Part A. 2021, 99(4): 372-381.
- Zhang X, Zhang R, Hao J, et al. miRNA‐122‐5p in POI ovarian‐derived exosomes promotes granulosa cell apoptosis by regulating BCL9. Cancer Medicine. 2022, 11(12): 2414-2426.
- Welsh J A, Goberdhan D C I, O'Driscoll L, et al. Minimal information for studies of extracellular vesicles (MISEV2023): From basic to advanced approaches. Journal of Extracellular Vesicles. 2024, 13(2): e12404.
Frequently Asked Questions
For any inquiries, our support team is ready to help you get technical support for your research and maximize your experience with Creative Biostructure.