Super-Resolution Exosome Imaging Services
Super-resolution microscopy (SRM) enables single-particle analysis of extracellular vesicles (EVs) beyond conventional optics, linking nanometer detail with molecular specificity. Creative Biostructure delivers standardized SRM using STED, SMLM (PALM and dSTORM), and DNA-PAINT to generate decision-ready data on morphology, composition, and biological context.
Why Super-Resolution for Exosomes?
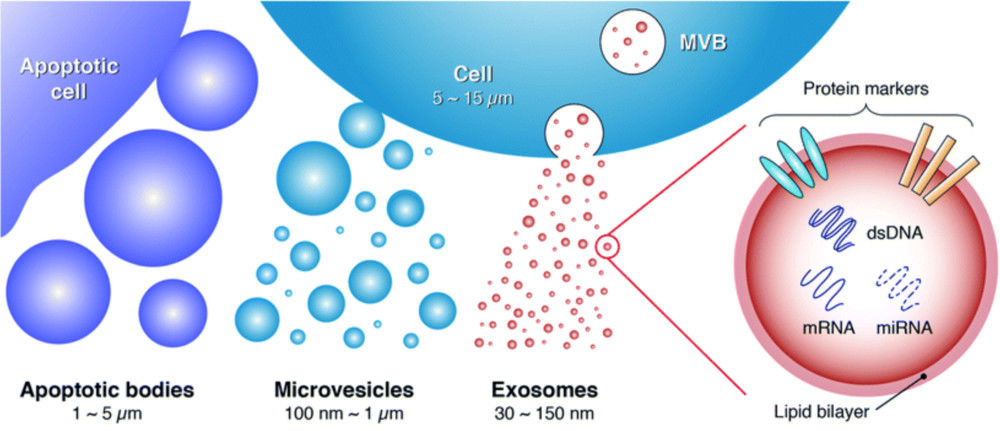
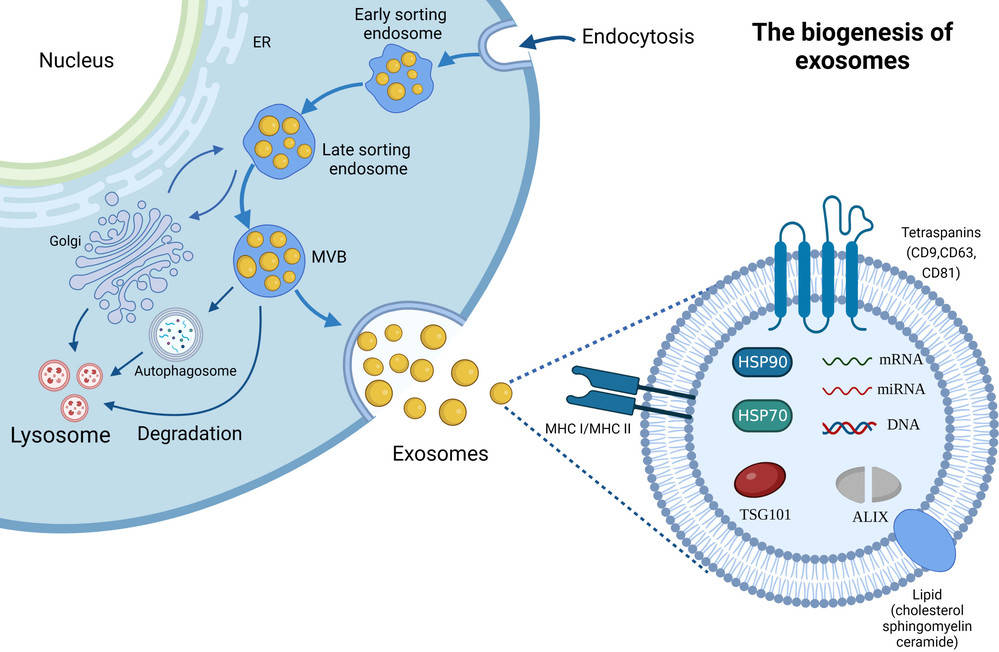
Exosomes and other small EVs (30-200 nm) sit below the diffraction limit of conventional light microscopy. That makes nanoscale mapping of membrane proteins (e.g., CD9/CD63/CD81) and cargo (miRNAs, DNA fragments) challenging with standard confocal. Super-resolution imaging, including STED, SMLM (PALM/dSTORM), and DNA-PAINT, resolves features at tens of nanometers, enabling:
- Single-vesicle phenotyping: quantify copy number and spatial organization of markers on individual EVs.
- Cargo localization: visualize nucleic acids and protein complexes at the molecule level.
- Live-cell insight: track EV uptake, trafficking, and release with sub-minute temporal resolution.
- Cohort comparisons: detect disease-enriched EV subsets in biofluids for discovery and triage studies.
Creative Biostructure integrates these modalities with rigorous labeling controls, calibrated optics, and quantitative analysis to generate publication-grade results that satisfy the reporting depth recommended by MISEV2023.
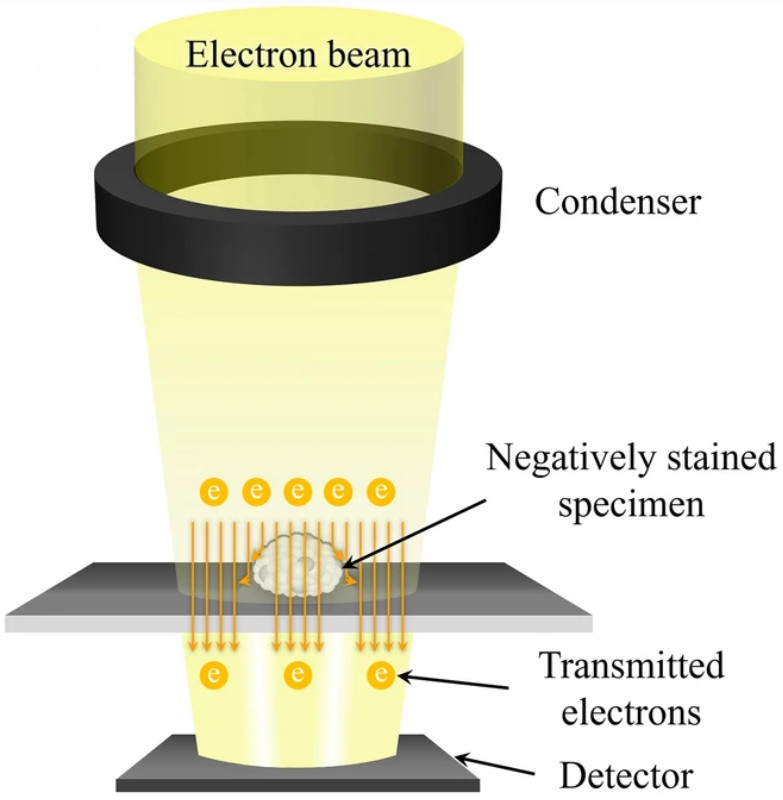
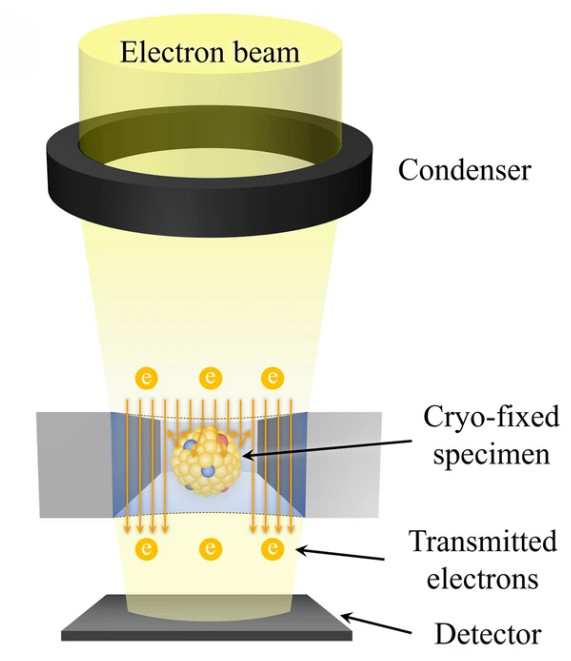
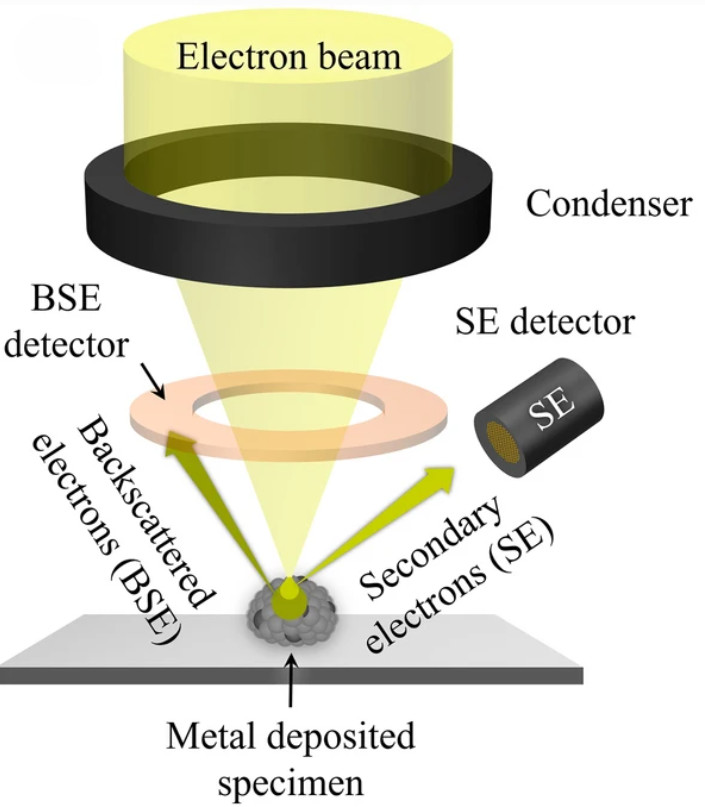
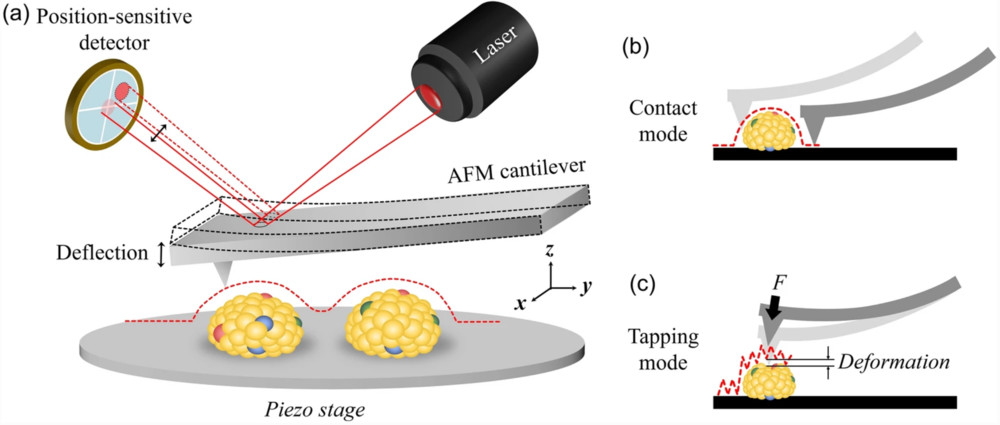
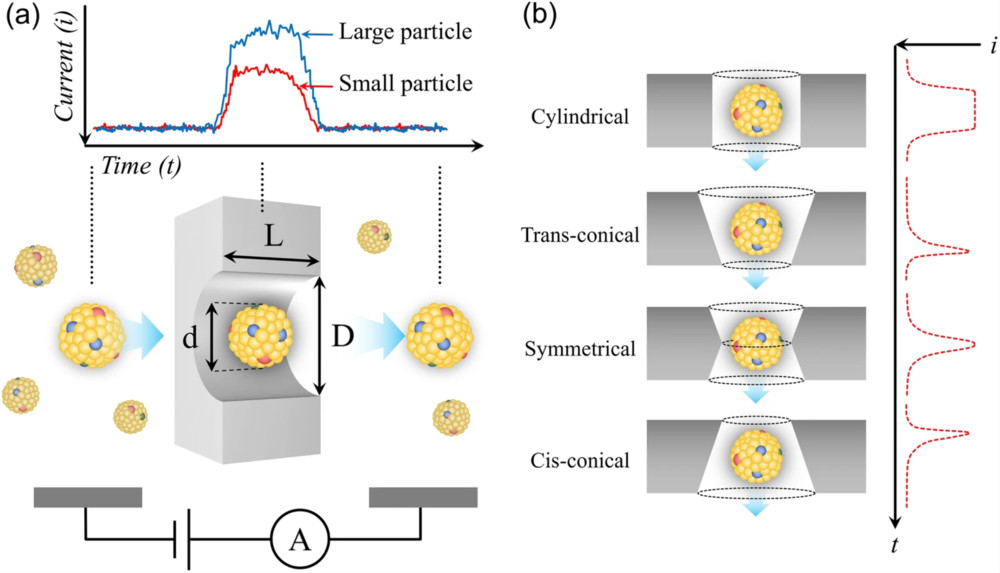
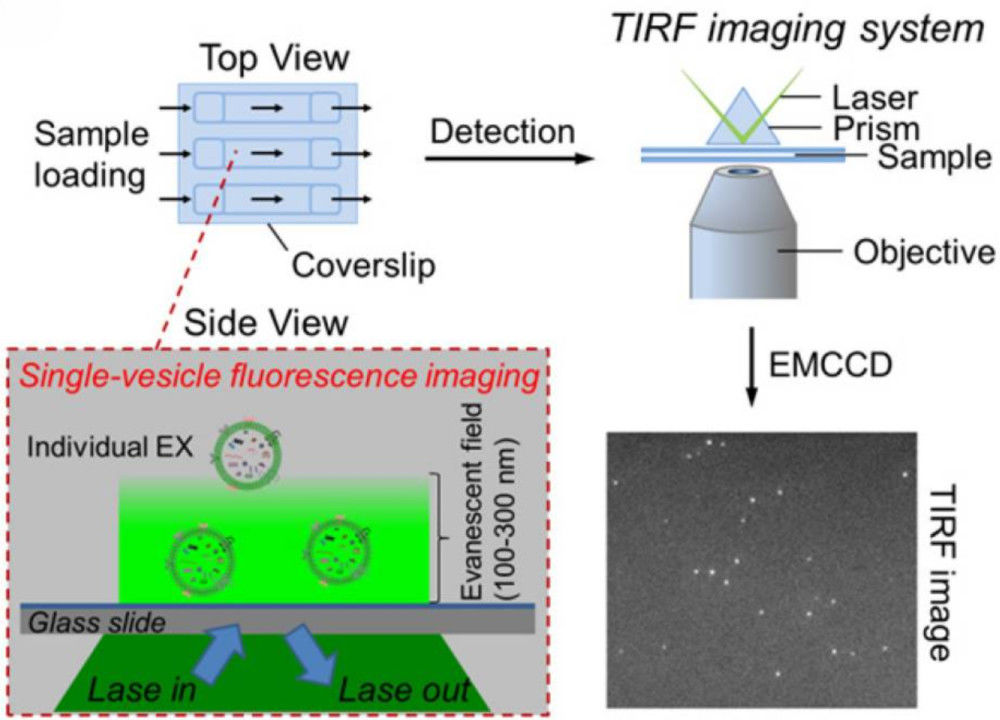
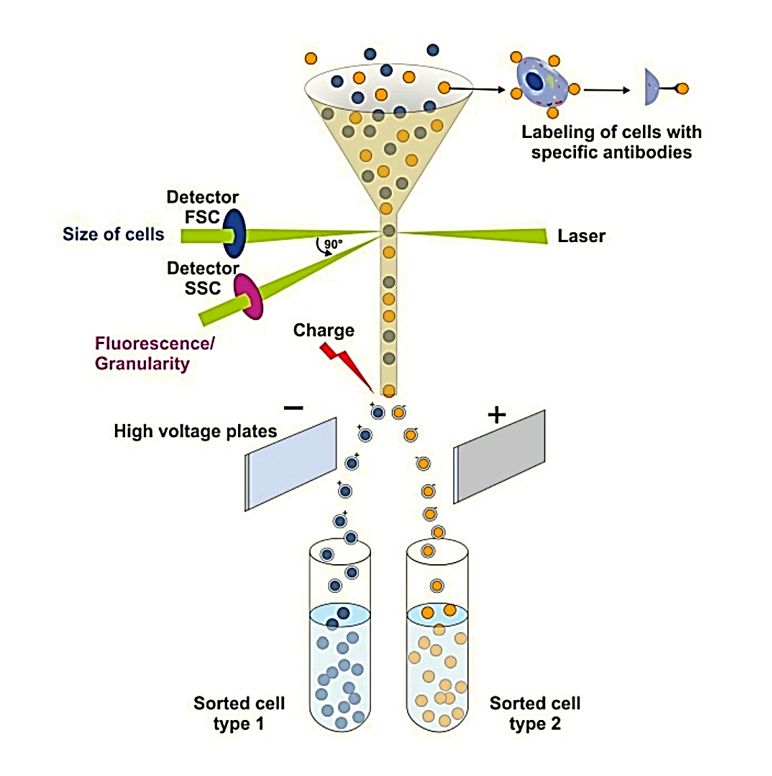
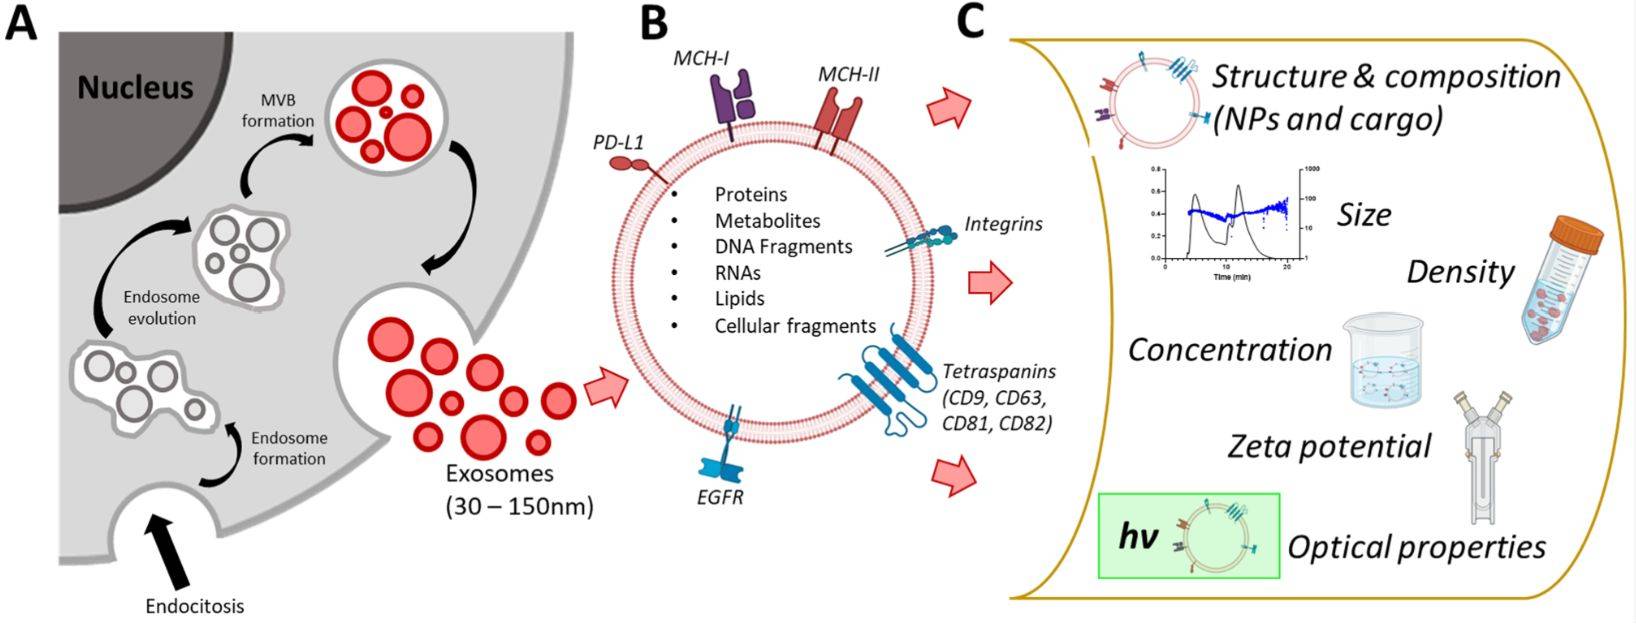
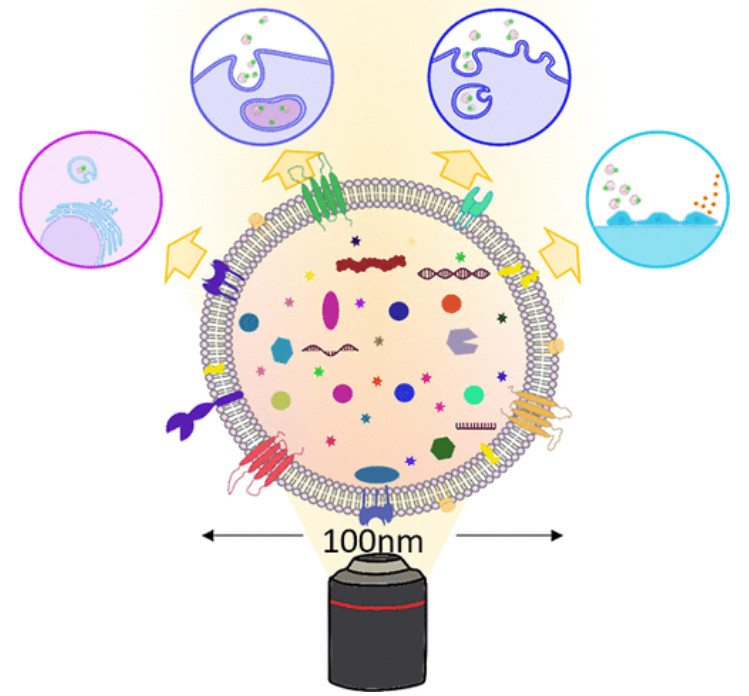 Figure 1. Super-Resolution Microscopy for Extracellular Vesicles. (Alexandre L, et al., 2025)
SRM Exosome Imaging Techniques We Offer
Creative Biostructure delivers multiple super-resolution modalities for extracellular vesicles, each validated for labeling specificity, optical calibration, and quantitative analysis.
SMLM for Ultimate Resolution
SMLM techniques, including dSTORM, PALM, and DNA-PAINT, provide the highest achievable spatial resolution. By precisely localizing thousands of individual fluorescent molecules over time, we reconstruct a comprehensive image with near-molecular detail.
Best For:
- Ultra-high resolution mapping of surface protein topology (e.g., tetraspanins CD9, CD63, CD81).
- Quantitative, single-vesicle analysis of biomarker expression and heterogeneity.
- Confirming co-localization of multiple proteins on the same exosome.
STED Microscopy for Speed and Live-Cell Dynamics
STED microscopy uses a specialized two-laser system to shrink the effective fluorescence emission spot, enabling direct, fast, and intuitive nanoscale imaging. Its speed makes it the ideal choice for observing biological processes as they happen.
Best For:
- High-speed imaging of dynamic events in living cells.
- Real-time tracking of exosome uptake, intracellular trafficking, and fusion events.
- Investigating the mechanisms of exosome biogenesis and release at the cell membrane.
| Feature | Single-Molecule Localization Microscopy (SMLM) | Stimulated Emission Depletion (STED) |
|---|---|---|
| Typical Resolution | 20-40 nm | 30-60 nm |
| Imaging Speed | Slower (image reconstruction required) | Fast (direct laser scanning) |
| Live-Cell Suitability | Excellent (low phototoxicity) | Very Good (requires careful optimization) |
| Ideal Applications | Quantitative mapping, heterogeneity studies | Live-cell dynamics, process tracking |
All projects include guidance on probe choice, channel alignment, chromatic correction, and analysis parameters to ensure reproducible, quantitative results.
What You Can Measure With Us
- Size and morphology at the nanoscale: per-vesicle apparent diameters (method-aware), membrane topology, and clustering.
- Protein topology and copy number: CD9/CD63/CD81 and disease-relevant markers (EGFR, HER2, EpCAM), including nanoscale co-organization.
- Nucleic acid localization: single-molecule miRNA/DNA fragment mapping and counts per vesicle.
- Cellular dynamics: EV uptake, trafficking, entotic processing, and release events in living cells.
- Comparative cohorts: healthy vs. disease plasma/serum EVs; treatment vs. control; cell line panels.
Our Exosome SRM Imaging Workflow
Expert Consultation
We begin with a deep dive into your project goals. Our specialists will discuss your research aims, sample type, and target molecules to recommend the optimal imaging strategy and labeling protocol.
Sample Preparation & QC
We provide detailed guidance for sample preparation, fixation, and fluorophore labeling to ensure the highest quality data. We work with both purified exosomes and cell culture models.
Super-Resolution Imaging
Your samples are imaged by our expert microscopists on our state-of-the-art, professionally maintained SMLM and STED systems.
Data Processing & Analysis
Raw data is processed using advanced, validated algorithms for image reconstruction (SMLM), deconvolution (STED), and denoising to produce crystal-clear images.
Comprehensive Reporting
You receive a complete data package, including a detailed report outlining all methods and parameters, high-resolution images, quantitative analysis results, and the raw data files.
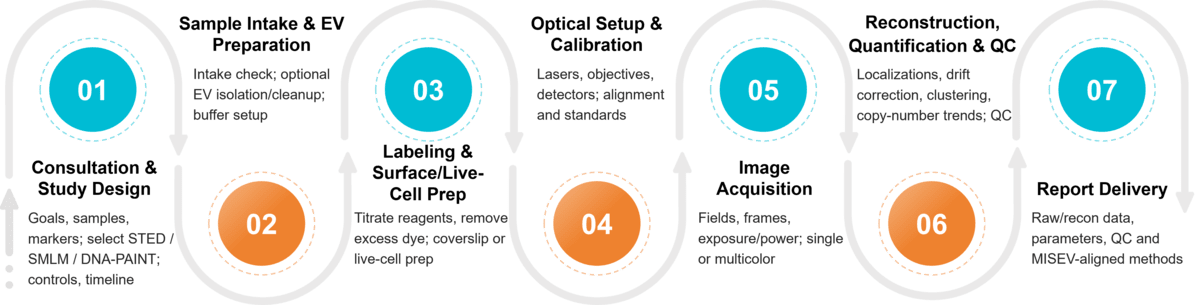 Figure 2. Project Workflow for Exosome Imaging by Super-resolution Microscopy. (Creative Biostructure)
Quality Assurance & Data Integrity
- Calibration: bead standards, illumination power logs, objective performance checks.
- Controls: negative/positive control samples; isotype and reagent-only runs.
- Reproducibility: technical replicates and optional biological replicates.
- Data governance: versioned analysis, audit trails, secure transfer, and retention per agreement.
- Integration: we can align results with proteomics, lipidomics, or NGS datasets generated in parallel.
Sample Requirements for SRM Exosome Imaging
| Requirement | Description |
|---|---|
| Accepted Matrices | Conditioned media; biofluids (plasma, serum, urine); purified EV fractions; size-exclusion or density-gradient outputs. |
| Isolation Compatibility | SEC, ultracentrifugation, density gradients, immuno-capture. Biases will be noted in the report. Isolation and cleanup can be performed on request. |
| Minimum Inputs (typical ranges; project-specific) | • Plasma/serum: 100-500 µL per target/channel • Conditioned media: 5-50 mL (cell type and yield dependent) • Provide recent particle counts (e.g., NTA/nanoFCM) if available |
| Storage & Shipping | Short term 4 °C; long term -80 °C. Avoid multiple freeze-thaw cycles and fluorescent preservatives. Ship on cold packs or dry ice per intake guidance. |
What Deliverables Will You Receive
- High-resolution images (STED, SMLM, DNA-PAINT; single and multicolor, with scale bars)
- Raw & reconstructed datasets (OME-TIFF/vendor raw plus deconvolved or localization reconstructions)
- Quantitative tables (per-vesicle metrics, clustering/co-localization, cohort summaries)
- QC & calibration brief (standards, alignment residuals, SNR, replicate checks)
- Methods appendix (labeling recipes, buffers, laser powers, frame budgets, optics)
- Publication-ready figures (TIFF/PNG and basic statistics)
Case Study
Case: Single-Cell EV Profiling of Human Macrophages by STORM
Objective
Quantify EV heterogeneity from individual macrophages and compare monocyte-derived subtypes with lung macrophages.
Approach
Macrophages were activated on IgG-supported bilayers; after cell detachment, secreted EVs were stained for tetraspanins and HLA-DR and imaged by STORM with nanoruler calibration. A sphingomyelinase inhibitor probed biogenesis.
Key Results
- HLA-DR+ EV frequency: ~39% (M1-like) vs ~13% (M0-like) and ~10% (M2-like); lung macrophage EVs ~81% HLA-DR+ with higher intensity.
- EV density at cell footprints: ~0.5-1.4 EV/μm2; lung macrophages secreted fewer EVs per area.
- Larger EVs were more often HLA-DR+. Cambinol reduced EV release, indicating a ceramide pathway.
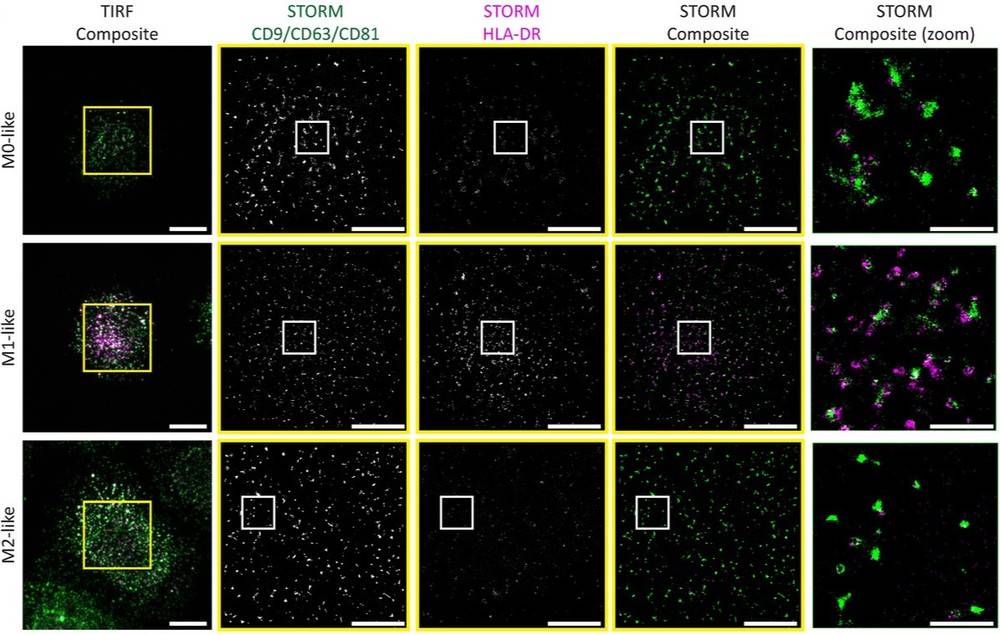 Figure 3. Representative STORM images show EVs secreted by M1-like macrophages exhibiting higher MHC class II signal. Scale bars: 5 μm; zoom: 1 μm. Yellow boxes indicate TIRF crops used for STORM reconstruction; white boxes mark zoomed STORM regions. (Dechantsreiter S, et al., 2022)
Implication
Super-resolution exosome imaging enables single-particle, single-cell phenotyping that resolves immune-state signatures and secretion mechanisms, providing data directly actionable for biomarker discovery and translational studies.
Ready to capture nanoscale detail with molecular certainty? Creative Biostructure offers MISEV2023 aligned super-resolution imaging for exosomes using STED, SMLM, and DNA-PAINT, with validated labeling, calibrated optics, and quantitative analysis. Share your targets and timeline, and we will design a study that delivers publication-ready data. Contact us to request a quote or schedule a consultation.
References
- Dechantsreiter S, Ambrose A R, Worboys J D, et al. Heterogeneity in extracellular vesicle secretion by single human macrophages revealed by super‐resolution microscopy. Journal of Extracellular Vesicles. 2022, 11(4): e12215.
- Welsh J A, Goberdhan D C I, O'Driscoll L, et al. Minimal information for studies of extracellular vesicles (MISEV2023): From basic to advanced approaches. Journal of Extracellular Vesicles. 2024, 13(2): e12404.
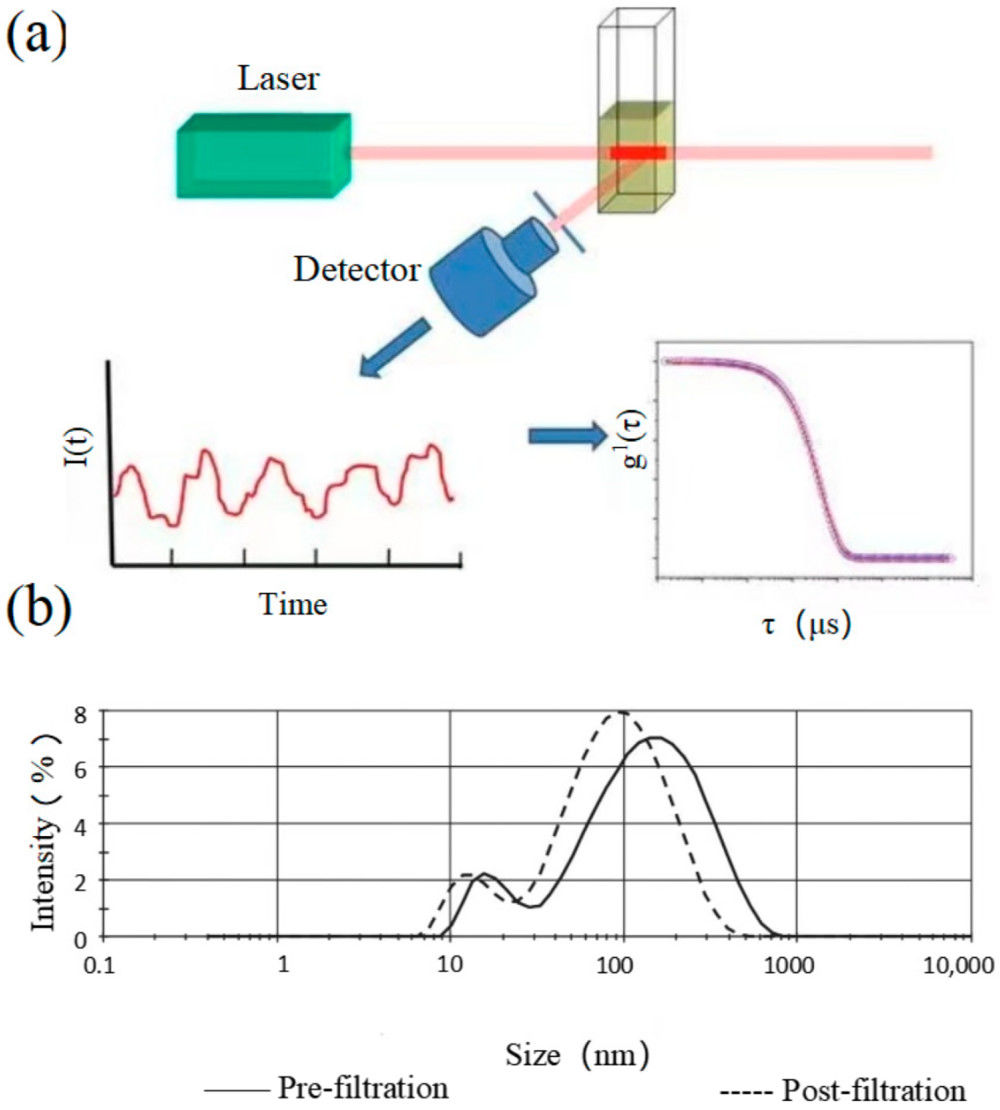
- Wu S, Zhao Y, Zhang Z, et al. The advances and applications of characterization technique for exosomes: from dynamic light scattering to super-resolution imaging technology. Photonics. MDPI, 2024, 11(2): 101.
Frequently Asked Questions
For any inquiries, our support team is ready to help you get technical support for your research and maximize your experience with Creative Biostructure.