Exosome Particle Size and Concentration Analysis Service
Creative Biostructure offers dedicated exosome particle size and concentration analysis services designed for both academic and industrial applications. Our workflows are developed in alignment with the latest MISEV2023 guidelines to ensure accuracy, reproducibility, and transparency. By integrating advanced single-particle characterization techniques with stringent quality control, we provide dependable data that can be directly applied to assay standardization, in vivo dosing studies, manufacturing quality checks, and product release testing.
What Is Exosome Particle Size and Concentration Analysis?
Particle size and concentration analysis quantifies extracellular vesicles (EVs), including exosomes, in terms of their size distribution (nanometers) and particle concentration (particles/mL). These parameters are critical for:
- Standardizing assay inputs for reproducible experiments
- Comparing EV profiles across samples and conditions
- Defining dosing strategies for therapeutic applications
Measurements can be influenced by factors such as the limit of detection (LOD) of the technique, the ability to distinguish EVs from co-isolated particles, and variations in data interpretation between analytical platforms. For example, hydrodynamic sizing methods like Nanoparticle Tracking Analysis (NTA) may report slightly larger diameters than high-resolution imaging methods due to differences in measurement principles.
To address these challenges, our approach incorporates orthogonal measurement strategies, defined LOD, and transparent reporting of instrument parameters to improve confidence and reproducibility.
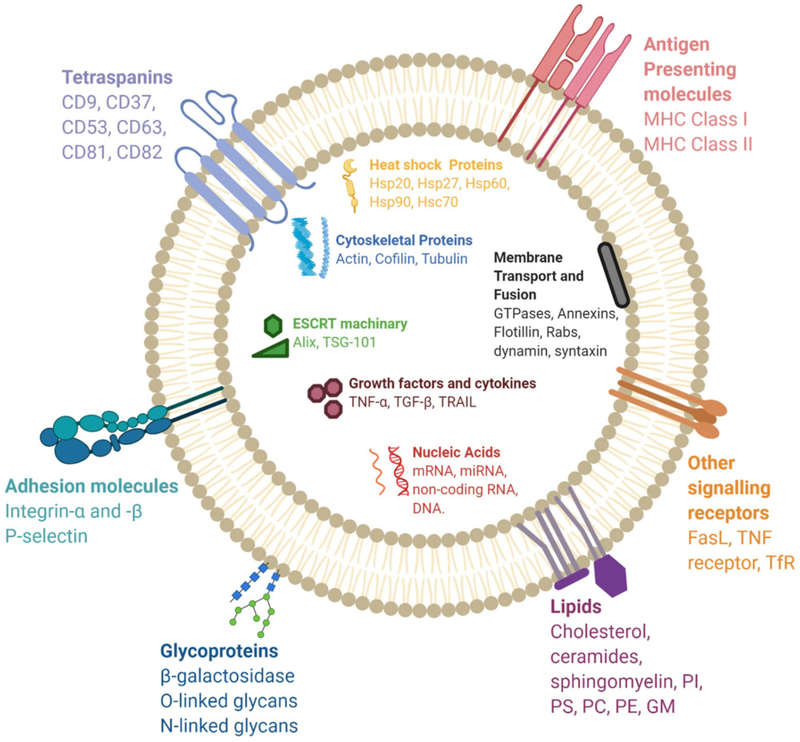
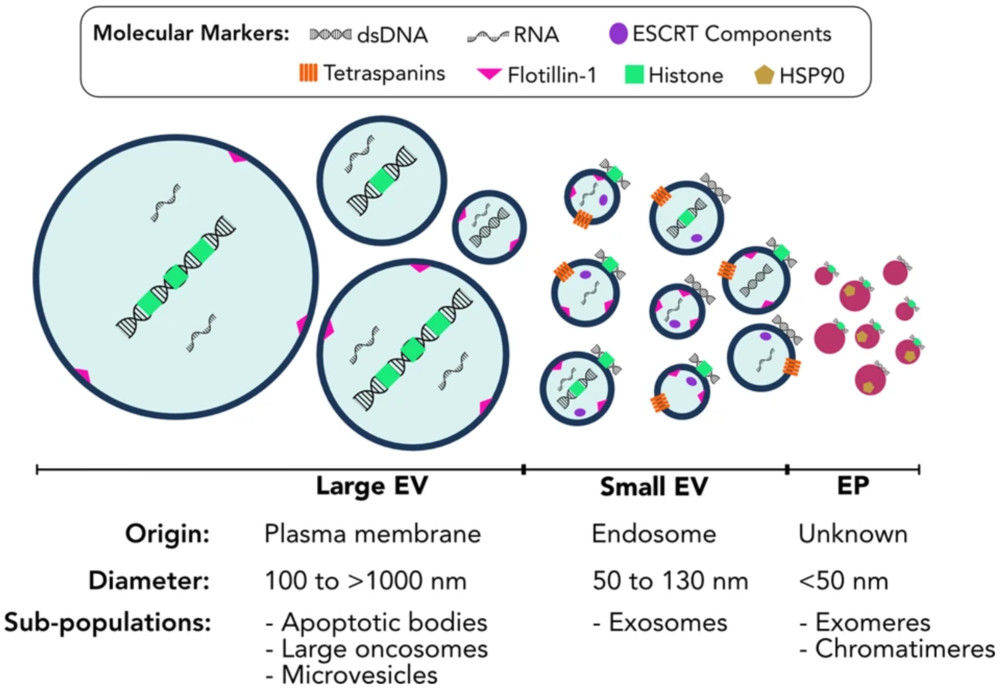 Figure 1. Extracellular vesicles and particles represent diverse populations varying in size, composition, and origin. (Malkin E Z, et al., 2020)
Our Analytical Capabilities for Exosome Particle Size and Concentration
We provide multiple single-particle characterization techniques, each with distinct advantages and limitations. To maximize accuracy, Creative Biostructure employs orthogonal measurement strategies, combining at least two complementary methods when feasible. This approach mitigates technique-specific biases and enhances data reliability.
| Technique | Measurement Principle | Size Range (nm) | LOD Definition | Concentration Measurement | Strengths | Limitations | Best Use Cases | Orthogonal Role |
|---|---|---|---|---|---|---|---|---|
| Nanoparticle Tracking Analysis (NTA) | Tracks Brownian motion via light scattering to determine hydrodynamic diameter | ~30-1000 | Not traceable; based on optical detection limits | Yes, in particles/mL | High-throughput, visual size distribution | Sensitive to refractive index; cannot distinguish EVs from non-EVs | General EV sizing & concentration profiling | Primary method; cross-checked with RPS or DLS |
| Resistive Pulse Sensing (RPS) | Detects electrical resistance changes as particles pass through a nanopore | ~50-2000 | Traceable in diameter (nm) | Yes, in particles/mL | High precision, defined size LOD | Lower throughput; pore size limits upper range | Calibration-standard-based sizing | Confirms NTA or DLS size data |
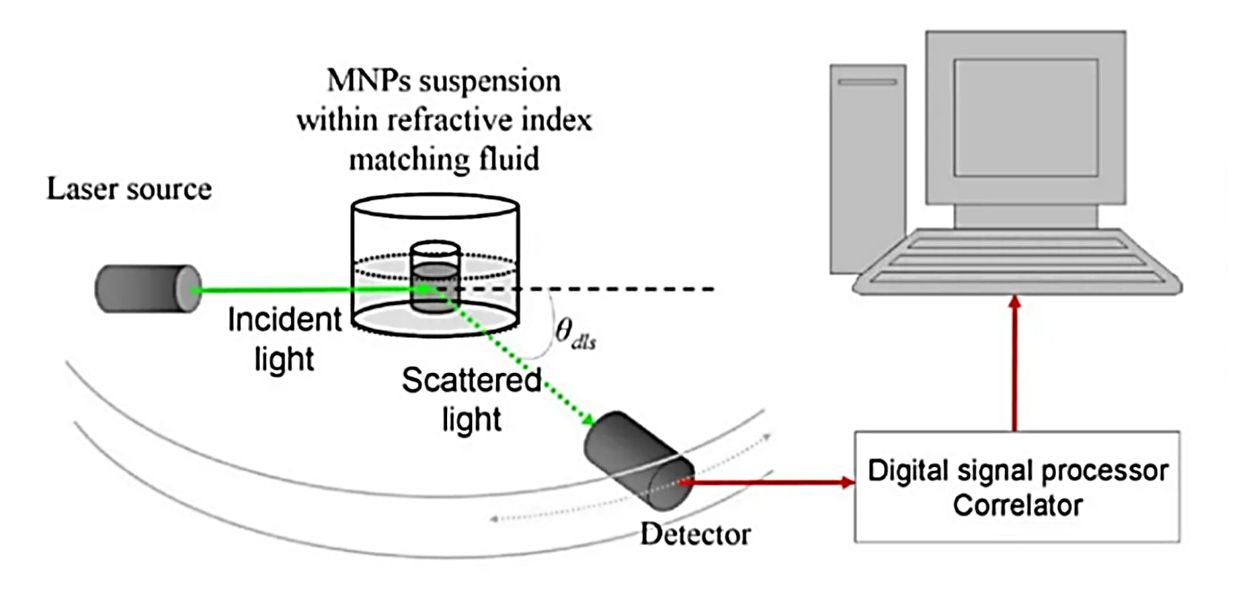
| Dynamic Light Scattering (DLS) | Measures light scattering intensity fluctuations to determine hydrodynamic diameter | ~1-6000 | Not traceable; software-derived | No (mean size only) | Rapid, non-destructive | Skewed by aggregates; limited resolution for polydisperse samples | Quick size estimation; detecting aggregation | Validates presence/absence of aggregates |
| High-Sensitivity Flow Cytometry | Measures light scatter and fluorescence for particle sizing and phenotyping | ~70-1500 | Derived from optical scattering models or MESF | Yes, when fluorescent labeling is used | Can link size with surface marker data | Requires fluorescent labeling; lower sensitivity for <100 nm | Phenotype-specific EV analysis | Complements size data with phenotypic information |
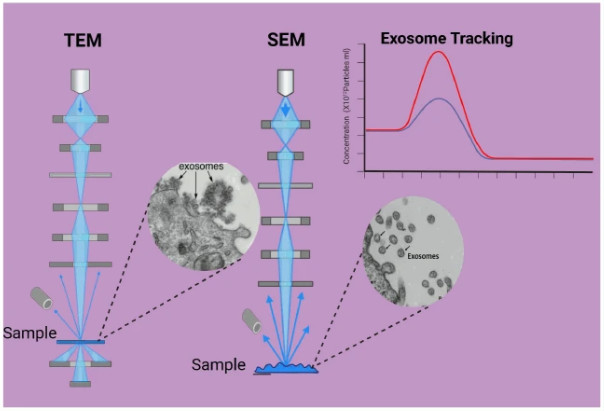
| Transmission Electron Microscopy (TEM) | Direct high-resolution imaging of individual vesicles using electron beam transmission | ~10-500+ | Defined by instrument resolution (1-2 nm typical) | No | Morphology confirmation; accurate structural sizing; visual purity assessment | Low throughput; potential sample deformation; not representative for concentration | Morphology validation; cross-check size with imaging | Confirms NTA/RPS/DLS size data; verifies vesicle integrity and purity |
Key Quality Features
- Defined LOD reporting for each method
- Orthogonal measurements to confirm findings
- Transparent disclosure of software version, calibration standards, and settings
- Clear distinction between "particle concentration" and "EV concentration" when specificity is limited
Orthogonal Measurement Strategy in Practice
- Example 1: NTA for full distribution profiling + RPS for traceable size confirmation + TEM for morphology validation.
- Example 2: NTA for concentration data + Flow Cytometry for phenotype-linked size validation + TEM for contamination check.
- Example 3: DLS screening for aggregation + NTA or RPS for detailed particle size/concentration + TEM for visual confirmation.
This comparative approach ensures clients receive comprehensive, cross-validated datasets that meet both research and industrial quality requirements.
Our Workflow for Exosome Particle Size and Concentration Analysis
Our workflow is designed to ensure accurate, reproducible, and standards-compliant exosome particle size and concentration analysis, from sample reception to final data delivery. Each step follows documented SOPs and incorporates rigorous quality control measures.
Sample Receipt and Verification
Accept both purified exosome preparations and upstream biological materials (e.g., cell culture supernatants, biofluids) while ensuring collection, storage, and transport comply with agreed SOPs to prevent degradation or aggregation.
Pre-Analysis Quality Control
Remove potential contaminants such as cell debris, protein aggregates, and non-vesicular particles using standardized purification protocols, and assess sample clarity and vesicle integrity before measurement.
Primary Measurement
Analyze using NTA, RPS, DLS, or flow cytometry based on sample type and project needs.
Orthogonal Validation
Perform a secondary, complementary measurement to confirm size and/or concentration results, reducing method-specific bias.
Example: NTA concentration results verified by RPS size calibration; morphology cross-checked by TEM imaging.
Data Processing and Reporting
Provide size distribution, particle concentration, LOD, full instrument documentation, and expert interpretation with recommendations for downstream applications.
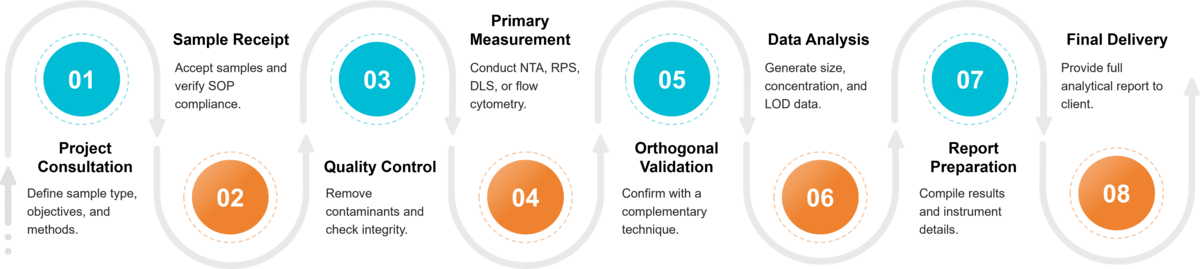 Figure 2. Project Workflow for Exosome Particle Size and Concentration Analysis. (Creative Biostructure)
Sample Requirements and Compatibility
| Sample Type | Minimum Volume | Preparation & Storage | Shipping |
|---|---|---|---|
| Purified Exosomes | ≥ 100 µL | Store in PBS or other suitable buffer at -80 °C; avoid repeated freeze–thaw cycles | Ship on dry ice |
| Plasma / Serum / Urine | ≥ 1 mL | Freeze at -80 °C immediately after collection | Ship on dry ice |
| Cell Culture Supernatant | ≥ 5 mL | Remove cells and debris by centrifugation; store at -80 °C | Ship on dry ice |
| Other Biological Fluids* | Contact us | Follow sample-specific preparation guidelines provided upon request | Ship on dry ice |
* Examples include saliva, cerebrospinal fluid (CSF), bile, breast milk, amniotic fluid, plant-derived fluids, and tissue homogenates. For less common matrices, please contact us for tailored instructions.
What Deliverables Will You Receive
Clients receive a complete analytical package including:
- Particle concentration (particles/mL)
- Full size distribution profile (not just mean/mode/median)
- LOD statement for each assay used
- Instrument and software details
- Expert interpretation of results
Applications and Use Cases
Our service is widely applicable across research and industrial sectors:
- Biomarker Discovery: Quantifying EV populations in biofluids for disease detection.
- Drug Delivery Development: Characterizing therapeutic exosome batches for consistency.
- Quality Control in Manufacturing: GMP-aligned particle analysis for release testing.
- In Vivo Studies: Accurate particle dosing to ensure reproducible outcomes.
Why Choose Creative Biostructure
- Standards-Compliant: Fully aligned with MISEV2023 guidelines and ISEV Task Force recommendations.
- Advanced Technology: Equipped with state-of-the-art NTA, RPS, and DLS platforms.
- Proven Expertise: Extensive CRO experience in EV characterization for academia and industry.
- Transparent Reporting: Clear LOD disclosure and orthogonal verification for reproducible results.
- Broad Application: Suitable for both research-grade and GMP-compatible workflows.
Case Study
Case: Particle Size and Concentration Analysis of Lyophilized Bovine Milk-Derived Exosomes
Background
This study focused on developing a GMP-compliant workflow for isolating bovine milk-derived exosomes (MK-Exo) and assessing their stability following lyophilization. A tangential flow filtration-size exclusion chromatography (TFF-SEC) protocol was optimized and compared with density-gradient ultracentrifugation. The particle size and concentration analysis was central to evaluating product quality and storage stability.
Methods and Results
- Isolation and Characterization: TEM confirmed the classic central depression morphology, and NanoFCM analysis showed over 98% of particles within 40-150 nm, with mean diameters around 50-60 nm.
- Purity and Protein Profiling: HPLC demonstrated high purity, and proteomic profiling identified 894 protein groups, including typical EV markers (CD9, CD63, CD81, TSG101, Alix) and minimal contaminant proteins.
- Stability Testing: Lyophilized MK-Exo, formulated with 5% trehalose and mannitol, maintained size distribution, zeta potential, and purity after reconstitution. Particle size analysis showed no significant changes pre- and post-lyophilization.
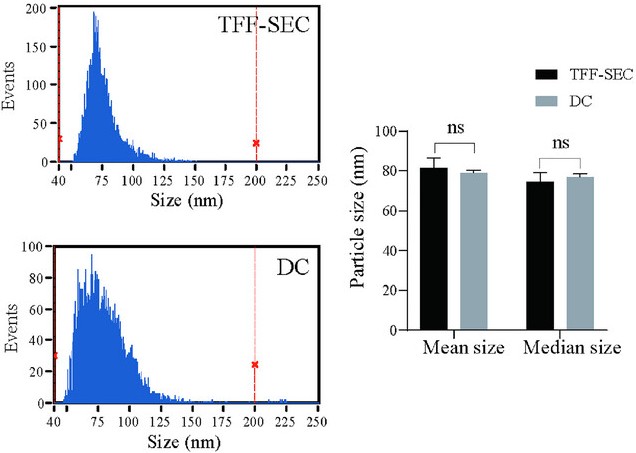 Figure 3. Particle Size Analysis of MK-Exo Prepared by TFF-SEC and DC. (Lu L, et al., 2024)
Conclusion
Comprehensive particle size and concentration analysis verified that the specialized TFF-SEC isolation combined with tailored lyophilization produced MK-Exo with high structural integrity and stability. This case underscores the value of robust sizing and counting methodologies in validating exosome preservation strategies for scalable production and distribution.
At Creative Biostructure, we combine advanced instrumentation, rigorous standards, and proven expertise to deliver exosome particle size and concentration data you can trust. Contact us to discuss your project and receive a tailored analysis plan.
References
- Malkin E Z, Bratman S V. Bioactive DNA from extracellular vesicles and particles. Cell Death & Disease. 2020, 11(7): 584.
- Welsh J A, Goberdhan D C I, O'Driscoll L, et al. Minimal information for studies of extracellular vesicles (MISEV2023): From basic to advanced approaches. Journal of Extracellular Vesicles. 2024, 13(2): e12404.
- Lu L, Han C, Wang M, et al. Assessment of bovine milk exosome preparation and lyophilized powder stability. Journal of Extracellular Biology. 2024, 3(11): e70009.
Frequently Asked Questions
For any inquiries, our support team is ready to help you get technical support for your research and maximize your experience with Creative Biostructure.